
Tesla stock trades up amid signs of a bounce from oversold territory

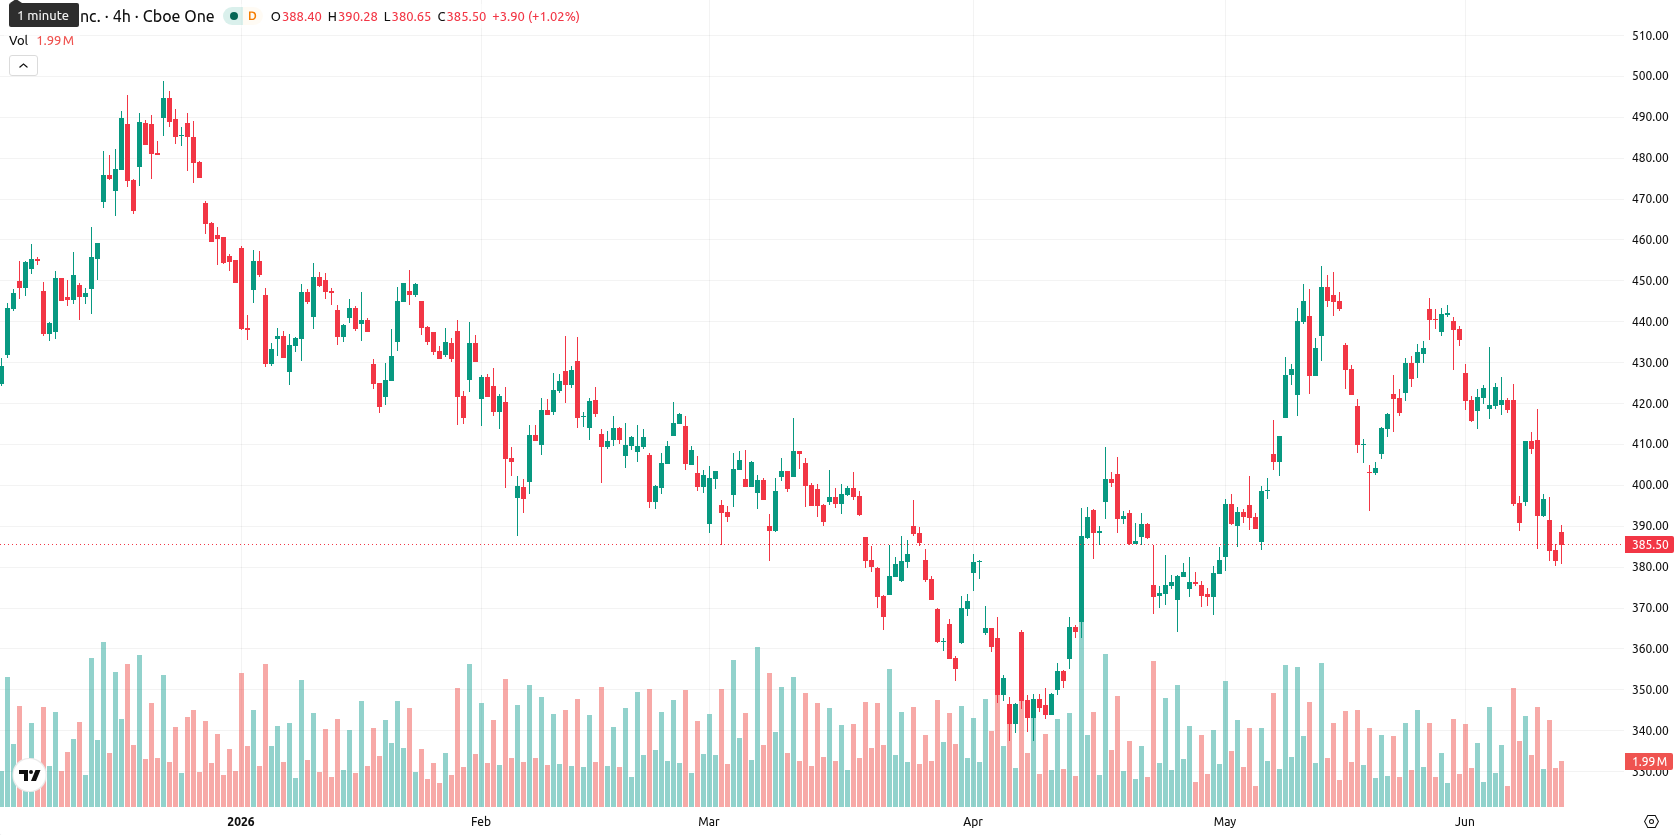
Tesla Inc. (TSLA) stock is trading at $384.93, up 1.00% for the day. The price remains below its key moving averages, indicating persistent short-term and medium-term downside pressure.
Highlights
- Tesla faces heightened legal and regulatory risks as owners initiate lawsuits over undelivered features, potentially leading to penalties and operational disruption.
- The company reports increased exposure to trade policy shifts, tariffs, and global geopolitical tensions, intensifying its risk environment and volatility.
- TSLA trades below major moving averages with dominant selling pressure, and is expected to oscillate between $365.78–$404.08 with a bearish bias.
Legal exposures and global risks drive heightened volatility
Tesla is currently facing mounting regulatory and legal scrutiny as owners in several countries have initiated court proceedings, alleging failures to deliver on promised vehicle features. This wave of litigation heightens both legal liabilities and reputational risk for the company, and could lead to financial penalties or operational changes that disrupt ongoing business. In parallel, Tesla's latest 10-Q filing highlights a growing exposure to trade policy shifts, tariffs, supply-chain costs, and intense regulatory oversight on Autopilot and related products, all of which contribute to a more challenging risk environment. Ongoing geopolitical tensions, such as the escalating U.S.-Iran conflict, further add to volatility and underscore Tesla's vulnerability to global policy and sentiment shifts.
Seller momentum dominates as oversold signals cluster below resistance
On the technical front, TSLA is positioned below the MA-20 at $411.24 and the MA-50 at $420.30 on the H4 timeframe, and also remains under the MA-200 at $415.14 on the daily chart. Immediate resistance is marked by the Ichimoku Kijun at $412.90. MACD signals a sell, ADX points to a neutral trend, and the RSI stands at 36.9, indicating oversold conditions. CCI and BBP both reinforce oversold readings, reflecting significant seller dominance, while Stoch RSI indicates strong potential for a short-term rebound. The Awesome Oscillator further underscores the ongoing downtrend.
Further declines favored as volatility band constrains upside
Over the next 2–3 trading days, TSLA is likely to fluctuate within a volatility band ranging from $365.78 to $404.08. The likelihood of an upward move is low at 23%, while further downside remains the more probable scenario. The base expectation is for price oscillation within the current corridor; a decisive break above resistance at $412.90 may initiate a short-term rally, whereas a drop below $365.78 could accelerate additional declines.
Earlier, analysts noted that Tesla was facing ongoing technical weakness and was likely to consolidate amid heightened regulatory and supply chain challenges. The addition of escalating legal disputes and geopolitical risks in the current environment increases downside risk, making a sustained close above the Ichimoku Kijun at $412.90 the key level to watch for a potential reversal.


-
 Afghanistan
-
 Albania
-
 Algeria
-
 Angola
-
 Argentina
-
 Armenia
-
 Australia
-
 Austria
-
 Azerbaijan
-
 Bahamas
-
 Bahrain
-
 Bangladesh
-
 Belarus
-
 Belgium
-
 Bolivia
-
 Botswana
-
 Brazil
-
 Brunei
-
 Bulgaria
-
 Cambodia
-
 Cameroon
-
 Canada
-
 Chile
Chile
-
 China
China
-
 Colombia
-
 Congo
Congo
-
 Costa Rica
-
 Cote d'Ivoire
-
 Croatia
-
 Cuba
Cuba
-
 Cyprus
-
 Czechia
-
 DR Congo
-
 Denmark
-
 Dominican Republic
-
 Ecuador
-
 Egypt
Egypt
-
 El Salvador
-
 Estonia
-
 Eswatini
-
 Ethiopia
-
 Finland
-
 France
-
 Georgia
-
 Germany
-
 Ghana
Ghana
-
 Greece
-
 Haiti
Haiti
-
 Hong Kong
-
 Hungary
-
 India
India
-
 Indonesia
-
 Iran, Islamic republic
-
 Iraq
Iraq
-
 Ireland
-
 Israel
-
 Italy
Italy
-
 Jamaica
-
 Japan
Japan
-
 Jordan
-
 Kazakhstan
-
 Kenya
Kenya
-
 Korea
Korea
-
 Kuwait
-
 Kyrgyzstan
-
 Laos
Laos
-
 Latvia
-
 Lebanon
-
 Lesotho
-
 Libya
Libya
-
 Lithuania
-
 Luxembourg
-
 Madagascar
-
 Malaysia
-
 Malta
Malta
-
 Mauritius
-
 Mexico
-
 Moldova
-
 Mongolia
-
 Montenegro
-
 Morocco
-
 Mozambique
-
 Myanmar
-
 Namibia
-
 Nepal
Nepal
-
 Netherlands
-
 New Zealand
-
 Nigeria
-
 North Macedonia
-
 Norway
-
 Oman
Oman
-
 Pakistan
-
 Palestine
-
 Panama
-
 Papua New Guinea
-
 Paraguay
-
 Peru
Peru
-
 Philippines
-
 Poland
-
 Portugal
-
 Puerto Rico
-
 Qatar
Qatar
-
 Reunion
-
 Romania
-
 Rwanda
-
 Saudi Arabia
-
 Serbia
-
 Singapore
-
 Slovakia
-
 Slovenia
-
 Somalia
-
 South Africa
-
 Spain
Spain
-
 Sri Lanka
-
 Sweden
-
 Switzerland
-
 Syria
Syria
-
 Taiwan
-
 Tajikistan
-
 Tanzania
-
 Thailand
-
 Trinidad and Tobago
-
 Tunisia
-
 Turkey
-
 UAE
UAE
-
 Uganda
-
 Ukraine
-
 United Kingdom
-
United States
-
 Uruguay
-
 Uzbekistan
-
 Venezuela
-
 Vietnam
-
 Yemen
Yemen
-
 Zambia
-
 Zimbabwe
- Forex
- Crypto
