
$1.43–$1.61 range keeps Nano Dimension stock anchored despite muted movement

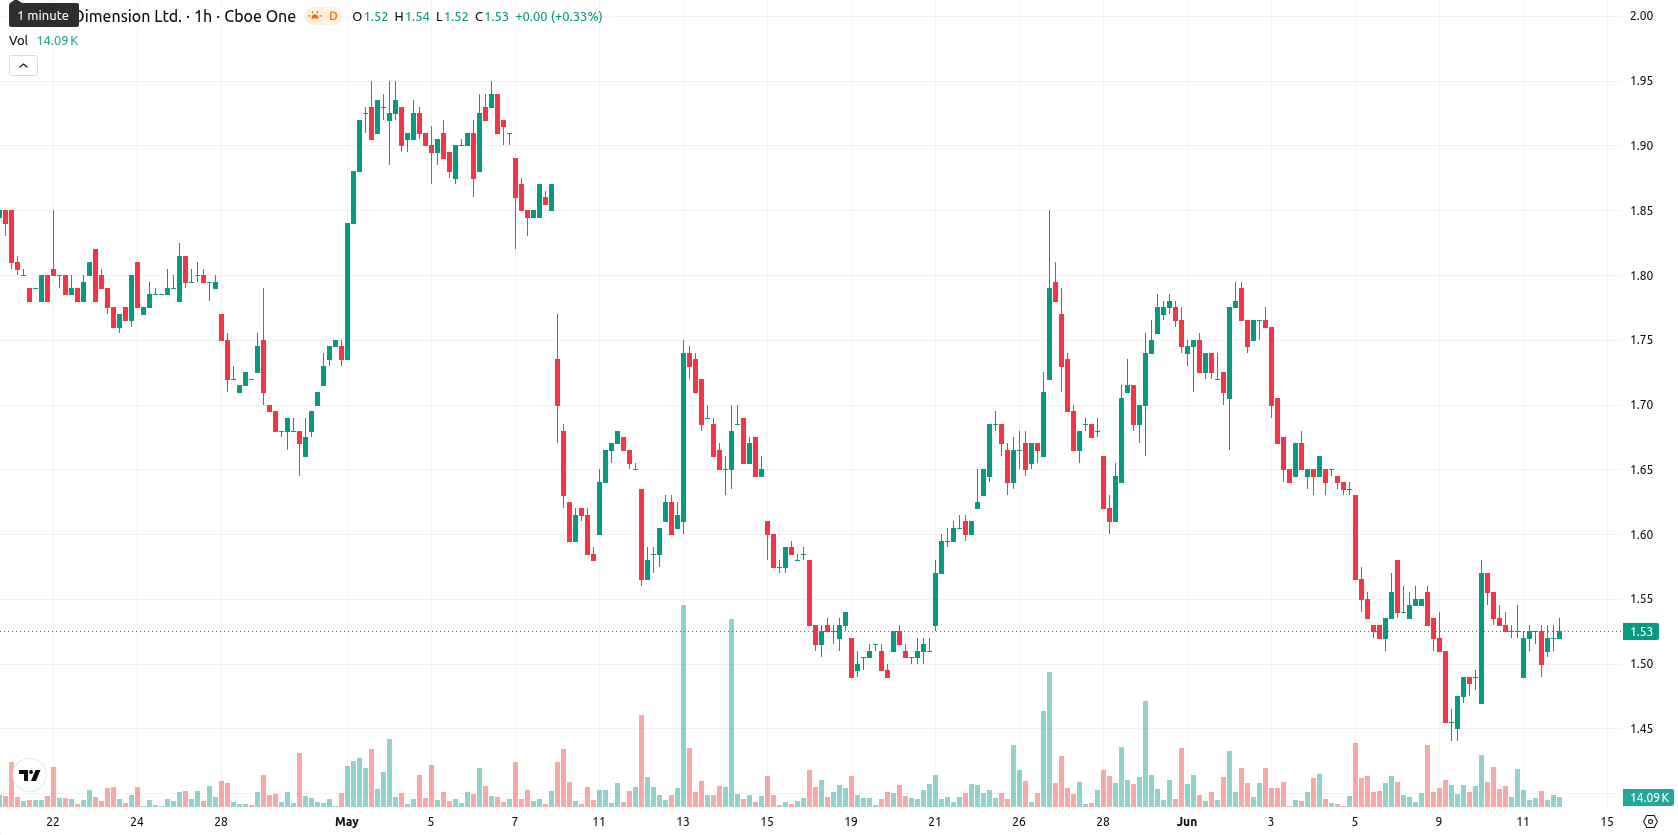
Nano Dimension Ltd (NNDM) stock is trading at $1.52, recording no change in price for the day. Shares are currently positioned above their short-term moving averages but remain below longer-term ones.
Highlights
- NNDM shows short-term price strength but remains under medium- and long-term technical pressure, signaling an overall bearish backdrop.
- Momentum indicators—including MACD, ADX, and RSI—align on strong selling pressure, while intraday volatility and mixed signals from buyers create divergence.
- NNDM is expected to trade sideways within the $1.43 to $1.61 range, with a 74% probability of moving lower and $1.51 providing pivotal support.
Selling momentum persists despite intraday buyer attempts
NNDM is trading above the MA-20, but remains below both the MA-50 and the MA-200. The Ichimoku Kijun sits at $1.51, providing immediate technical support. Momentum studies, including MACD and ADX, register strong selling pressure, while RSI and Stoch RSI are both in sell territory. The CCI is neutral, suggesting the stock is not oversold, and BBP reflects intraday buyer dominance that is not strong enough to offset broader weakness. Price action is volatile, with oscillators showing a divergence between short-term buyers and persistent negative momentum.
Sideways bias expected amid downside breakout risk
In the short term, NNDM is expected to trade within the $1.43 to $1.61 band, reflecting typical recent volatility. There is a 26% probability of a move higher, while the likelihood of a decline stands at 74%. The base case scenario is sideways trading within this range, with a breakout above resistance needed to trigger a bullish move or a break below $1.51 increasing the chance of further downside toward recent lows.
Earlier, analysts noted that Nano Dimension was experiencing persistent bearish momentum and sustained downside risk. The current analysis reaffirms this cautious outlook, highlighting that traders should closely monitor shifts in volatility and be alert to any decisive break above resistance or below support, as these may define the next major price direction.


Latest Nano Dimension News


-
 Afghanistan
-
 Albania
-
 Algeria
-
 Angola
-
 Argentina
-
 Armenia
-
 Australia
-
 Austria
-
 Azerbaijan
-
 Bahamas
-
 Bahrain
-
 Bangladesh
-
 Belarus
-
 Belgium
-
 Bolivia
-
 Botswana
-
 Brazil
-
 Brunei
-
 Bulgaria
-
 Cambodia
-
 Cameroon
-
 Canada
-
 Chile
Chile
-
 China
China
-
 Colombia
-
 Congo
Congo
-
 Costa Rica
-
 Cote d'Ivoire
-
 Croatia
-
 Cuba
Cuba
-
 Cyprus
-
 Czechia
-
 DR Congo
-
 Denmark
-
 Dominican Republic
-
 Ecuador
-
 Egypt
Egypt
-
 El Salvador
-
 Estonia
-
 Eswatini
-
 Ethiopia
-
 Finland
-
 France
-
 Georgia
-
 Germany
-
 Ghana
Ghana
-
 Greece
-
 Haiti
Haiti
-
 Hong Kong
-
 Hungary
-
 India
India
-
 Indonesia
-
 Iran, Islamic republic
-
 Iraq
Iraq
-
 Ireland
-
 Israel
-
 Italy
Italy
-
 Jamaica
-
 Japan
Japan
-
 Jordan
-
 Kazakhstan
-
 Kenya
Kenya
-
 Korea
Korea
-
 Kuwait
-
 Kyrgyzstan
-
 Laos
Laos
-
 Latvia
-
 Lebanon
-
 Lesotho
-
 Libya
Libya
-
 Lithuania
-
 Luxembourg
-
 Madagascar
-
 Malaysia
-
 Malta
Malta
-
 Mauritius
-
 Mexico
-
 Moldova
-
 Mongolia
-
 Montenegro
-
 Morocco
-
 Mozambique
-
 Myanmar
-
 Namibia
-
 Nepal
Nepal
-
 Netherlands
-
 New Zealand
-
 Nigeria
-
 North Macedonia
-
 Norway
-
 Oman
Oman
-
 Pakistan
-
 Palestine
-
 Panama
-
 Papua New Guinea
-
 Paraguay
-
 Peru
Peru
-
 Philippines
-
 Poland
-
 Portugal
-
 Puerto Rico
-
 Qatar
Qatar
-
 Reunion
-
 Romania
-
 Rwanda
-
 Saudi Arabia
-
 Serbia
-
 Singapore
-
 Slovakia
-
 Slovenia
-
 Somalia
-
 South Africa
-
 Spain
Spain
-
 Sri Lanka
-
 Sweden
-
 Switzerland
-
 Syria
Syria
-
 Taiwan
-
 Tajikistan
-
 Tanzania
-
 Thailand
-
 Trinidad and Tobago
-
 Tunisia
-
 Turkey
-
 UAE
UAE
-
 Uganda
-
 Ukraine
-
 United Kingdom
-
United States
-
 Uruguay
-
 Uzbekistan
-
 Venezuela
-
 Vietnam
-
 Yemen
Yemen
-
 Zambia
-
 Zimbabwe
- Forex
- Crypto
