
Alphabet stock price forecast: $348.38–$371.30 range as GOOGL trades flat

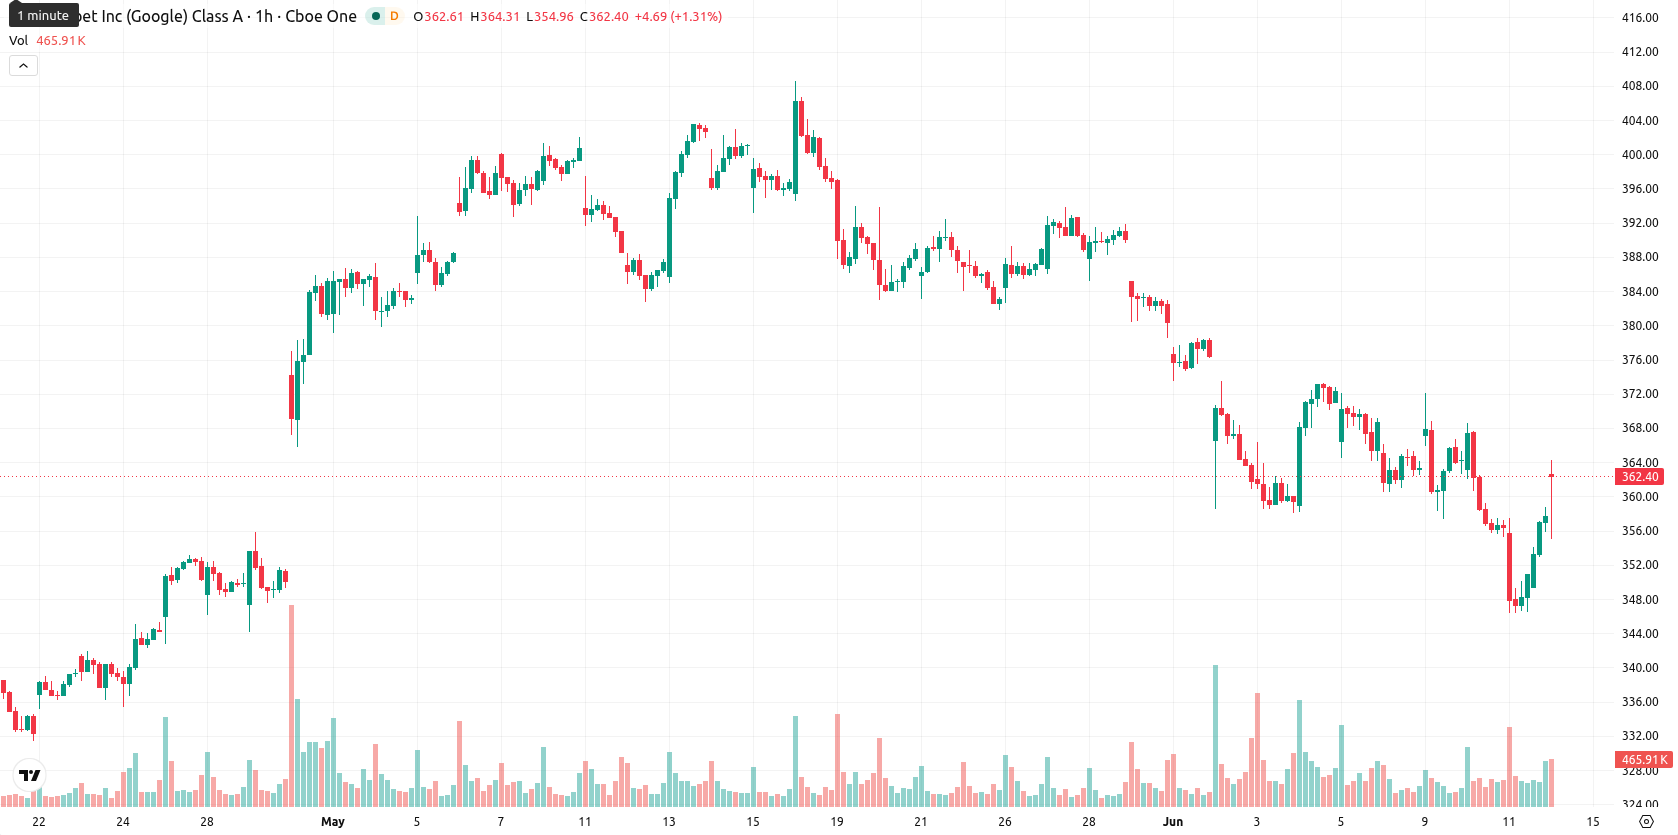
Alphabet Inc. (GOOGL) stock is trading at $359.84, up 0.51% on the day, with the session closing near the daily high and a measured 1.1 gap. The asset is positioned above its key short-term averages but continues to show mixed signals relative to broader moving averages.
Highlights
- Alphabet posted quarterly revenue of $109.9 billion, up 22% year-over-year, surpassing analyst expectations with strong core business demand.
- The company raised its quarterly dividend to $0.22 per share and announced a major AI chip partnership with Samsung and TSMC, expanding its growth initiatives.
- Technically, GOOGL/USD faces a likely sideways to lower move within the $348.38–$371.30 range, as momentum and oscillators signal indecision and bearish bias.
Earnings beat and AI chip deal drive buying after outlook upgrade
Alphabet’s latest earnings release revealed total revenue of $109.9 billion for the most recent quarter, a 22% year-over-year increase, with earnings per share rising to $5.11 — both exceeding analyst projections and underscoring robust demand for its core businesses, according to Parameter. This outperformance supports buying interest as it signals strong ongoing execution and operational efficiency. Alongside these results, Alphabet increased its quarterly dividend to $0.22 per share for shareholders of record as of June 8, expanded its 2021 Stock Plan by 200 million shares following shareholder approval (TipRanks), and announced a strategic partnership with Samsung and TSMC to develop a next-generation AI chip (Parameter), all of which reinforce its ongoing growth agenda.
Resistance holds as divergence emerges between price and momentum
On the H1 chart, GOOGL/USD trades above the MA-20 but remains below the MA-50, indicating a near-term hesitance despite holding well above the MA-200. The Ichimoku Kijun level at $359.22 offers immediate support, with the expected price corridor outlined by key levels at $348.38 (support) and $371.30 (resistance). Momentum indicators—including MACD and ADX—signal ongoing sell conditions, while the RSI at 49.49 suggests a subtle downside bias. Shorter-term oscillators such as Stoch RSI and BBP identify overbought conditions with persistent intraday buying, though CCI and the Awesome Oscillator remain neutral, pointing to a divergence between price action and underlying impetus.
Rangebound path likely as downside risk outweighs breakout potential
For the short term, the typical volatility band is expected between $348.38 and $371.30. There is a 65% probability of a decline, with a sideways scenario dominant unless the price decisively breaks above resistance or falls below immediate support. Upward movement would likely require a sustained close above $371.30, whereas a breakdown below $359.22 could accelerate retracement toward the lower end of the current range.
Earlier, analysts noted that Alphabet was facing rising competitive pressure in online real estate as Google continued expanding its advertising footprint. The current technical and earnings outlook suggests a neutral-to-cautiously-bullish bias, with price action likely to pivot around the $359.22 support—making that level crucial for gauging short-term momentum shifts.


Latest Google News


-
 Afghanistan
-
 Albania
-
 Algeria
-
 Angola
-
 Argentina
-
 Armenia
-
 Australia
-
 Austria
-
 Azerbaijan
-
 Bahamas
-
 Bahrain
-
 Bangladesh
-
 Belarus
-
 Belgium
-
 Bolivia
-
 Botswana
-
 Brazil
-
 Brunei
-
 Bulgaria
-
 Cambodia
-
 Cameroon
-
 Canada
-
 Chile
Chile
-
 China
China
-
 Colombia
-
 Congo
Congo
-
 Costa Rica
-
 Cote d'Ivoire
-
 Croatia
-
 Cuba
Cuba
-
 Cyprus
-
 Czechia
-
 DR Congo
-
 Denmark
-
 Dominican Republic
-
 Ecuador
-
 Egypt
Egypt
-
 El Salvador
-
 Estonia
-
 Eswatini
-
 Ethiopia
-
 Finland
-
 France
-
 Georgia
-
 Germany
-
 Ghana
Ghana
-
 Greece
-
 Haiti
Haiti
-
 Hong Kong
-
 Hungary
-
 India
India
-
 Indonesia
-
 Iran, Islamic republic
-
 Iraq
Iraq
-
 Ireland
-
 Israel
-
 Italy
Italy
-
 Jamaica
-
 Japan
Japan
-
 Jordan
-
 Kazakhstan
-
 Kenya
Kenya
-
 Korea
Korea
-
 Kuwait
-
 Kyrgyzstan
-
 Laos
Laos
-
 Latvia
-
 Lebanon
-
 Lesotho
-
 Libya
Libya
-
 Lithuania
-
 Luxembourg
-
 Madagascar
-
 Malaysia
-
 Malta
Malta
-
 Mauritius
-
 Mexico
-
 Moldova
-
 Mongolia
-
 Montenegro
-
 Morocco
-
 Mozambique
-
 Myanmar
-
 Namibia
-
 Nepal
Nepal
-
 Netherlands
-
 New Zealand
-
 Nigeria
-
 North Macedonia
-
 Norway
-
 Oman
Oman
-
 Pakistan
-
 Palestine
-
 Panama
-
 Papua New Guinea
-
 Paraguay
-
 Peru
Peru
-
 Philippines
-
 Poland
-
 Portugal
-
 Puerto Rico
-
 Qatar
Qatar
-
 Reunion
-
 Romania
-
 Rwanda
-
 Saudi Arabia
-
 Serbia
-
 Singapore
-
 Slovakia
-
 Slovenia
-
 Somalia
-
 South Africa
-
 Spain
Spain
-
 Sri Lanka
-
 Sweden
-
 Switzerland
-
 Syria
Syria
-
 Taiwan
-
 Tajikistan
-
 Tanzania
-
 Thailand
-
 Trinidad and Tobago
-
 Tunisia
-
 Turkey
-
 UAE
UAE
-
 Uganda
-
 Ukraine
-
 United Kingdom
-
United States
-
 Uruguay
-
 Uzbekistan
-
 Venezuela
-
 Vietnam
-
 Yemen
Yemen
-
 Zambia
-
 Zimbabwe
- Forex
- Crypto
