
Synopsys stock rises as executive insider buying signals management confidence

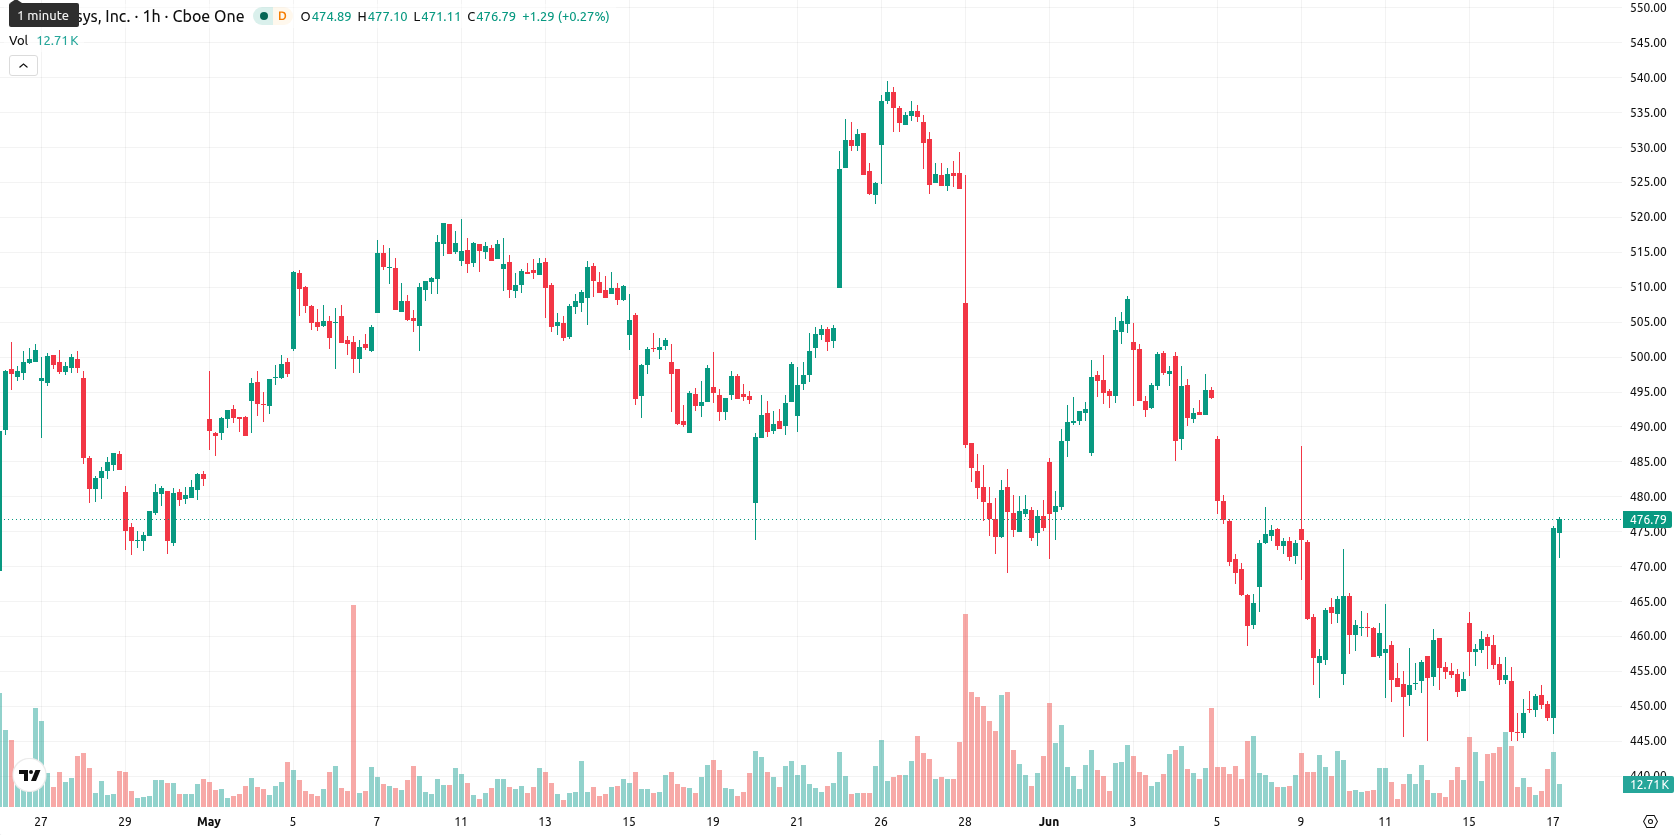
Synopsys, Inc. (SNPS) stock is trading at $474.99, up 5.94% on the day. The price sits above its key moving averages, reflecting strong momentum in the short, medium, and long terms.
Highlights
- Synopsys expands its simulation tools by integrating Murata’s advanced modeling capabilities, enhancing its value proposition for electronic circuit designers.
- Company momentum is underscored by the CEO’s insider purchase and the opening of a new office in Hsinchu Science Park, Taiwan.
- SNPS closed at $474.99, with technicals signaling overbought conditions and a high probability of a pullback within the $448.75–$483.66 trading range.
Product demand surges as Murata alliance and milestones fuel appeal
Synopsys, Inc. has announced a new collaboration with Murata Manufacturing that integrates Murata’s simulation models, including Ansys HFSS and Icepak support, into Synopsys simulation tools—substantially expanding the software's capabilities and boosting its appeal for electronic circuit designers. This partnership directly increases demand for Synopsys products and enhances its competitive advantage within the design automation market. Additional developments include a notable insider transaction by President & CEO Sassine Ghazi on June 16, 2026, as well as the celebration of the company's 35th anniversary in Taiwan marked by the opening of a new office at Hsinchu Science Park, both of which further highlight operational momentum and management conviction.
Technical divergences emerge as SNPS sits above pivotal support
Technically, SNPS is positioned above the MA-20 ($453.95) and MA-50 ($459.22) on the hourly chart, as well as the MA-200 ($460.87) for a longer-term outlook. Immediate support is defined by the Ichimoku Kijun at $457.06, with the expected trading band spanning $448.75 to $483.66 for the next few sessions. Among oscillators, RSI stands at 64.57 (Buy), though Stoch RSI, CCI, and BBP all indicate overbought conditions and dominant buyer activity. Momentum readings are mixed, with a strong sell signal from MACD, a positive ADX, and a neutral Awesome Oscillator, reflecting noticeable divergences between intraday momentum and oscillator readings.
Downside risk elevated as overbought signals cap upside scope
In the short term, SNPS is expected to trade within the $448.75 to $483.66 range, marking a typical volatility band relative to current levels. While the probability of a further upside move is considered very low due to overbought oscillators, the likelihood of a price decline is high. A close above $483.66 could trigger a brief bullish extension, but a break below $448.75 would open the way for a deeper pullback. Sideways movement is most likely if the price remains within the established band.
Earlier, analysts noted that Synopsys was consolidating near support levels amid persistent bearish momentum and a lack of clear directional signals. The recent shift to strong short- and long-term momentum, backed by positive business developments, signals a potential bullish phase, but traders should closely monitor the $448.75 support level for early signs of a trend reversal.


Latest Synopsys News


-
 Afghanistan
-
 Albania
-
 Algeria
-
 Angola
-
 Argentina
-
 Armenia
-
 Australia
-
 Austria
-
 Azerbaijan
-
 Bahamas
-
 Bahrain
-
 Bangladesh
-
 Belarus
-
 Belgium
-
 Bolivia
-
 Botswana
-
 Brazil
-
 Brunei
-
 Bulgaria
-
 Cambodia
-
 Cameroon
-
 Canada
-
 Chile
Chile
-
 China
China
-
 Colombia
-
 Congo
Congo
-
 Costa Rica
-
 Cote d'Ivoire
-
 Croatia
-
 Cuba
Cuba
-
 Cyprus
-
 Czechia
-
 DR Congo
-
 Denmark
-
 Dominican Republic
-
 Ecuador
-
 Egypt
Egypt
-
 El Salvador
-
 Estonia
-
 Eswatini
-
 Ethiopia
-
 Finland
-
 France
-
 Georgia
-
 Germany
-
 Ghana
Ghana
-
 Greece
-
 Haiti
Haiti
-
 Hong Kong
-
 Hungary
-
 India
India
-
 Indonesia
-
 Iran, Islamic republic
-
 Iraq
Iraq
-
 Ireland
-
 Israel
-
 Italy
Italy
-
 Jamaica
-
 Japan
Japan
-
 Jordan
-
 Kazakhstan
-
 Kenya
Kenya
-
 Korea
Korea
-
 Kuwait
-
 Kyrgyzstan
-
 Laos
Laos
-
 Latvia
-
 Lebanon
-
 Lesotho
-
 Libya
Libya
-
 Lithuania
-
 Luxembourg
-
 Madagascar
-
 Malaysia
-
 Malta
Malta
-
 Mauritius
-
 Mexico
-
 Moldova
-
 Mongolia
-
 Montenegro
-
 Morocco
-
 Mozambique
-
 Myanmar
-
 Namibia
-
 Nepal
Nepal
-
 Netherlands
-
 New Zealand
-
 Nigeria
-
 North Macedonia
-
 Norway
-
 Oman
Oman
-
 Pakistan
-
 Palestine
-
 Panama
-
 Papua New Guinea
-
 Paraguay
-
 Peru
Peru
-
 Philippines
-
 Poland
-
 Portugal
-
 Puerto Rico
-
 Qatar
Qatar
-
 Reunion
-
 Romania
-
 Rwanda
-
 Saudi Arabia
-
 Serbia
-
 Singapore
-
 Slovakia
-
 Slovenia
-
 Somalia
-
 South Africa
-
 Spain
Spain
-
 Sri Lanka
-
 Sweden
-
 Switzerland
-
 Syria
Syria
-
 Taiwan
-
 Tajikistan
-
 Tanzania
-
 Thailand
-
 Trinidad and Tobago
-
 Tunisia
-
 Turkey
-
 UAE
UAE
-
 Uganda
-
 Ukraine
-
 United Kingdom
-
United States
-
 Uruguay
-
 Uzbekistan
-
 Venezuela
-
 Vietnam
-
 Yemen
Yemen
-
 Zambia
-
 Zimbabwe
- Forex
- Crypto
