
AST SpaceMobile stock price forecast: $71.8 support as ASTS slides 5.58%

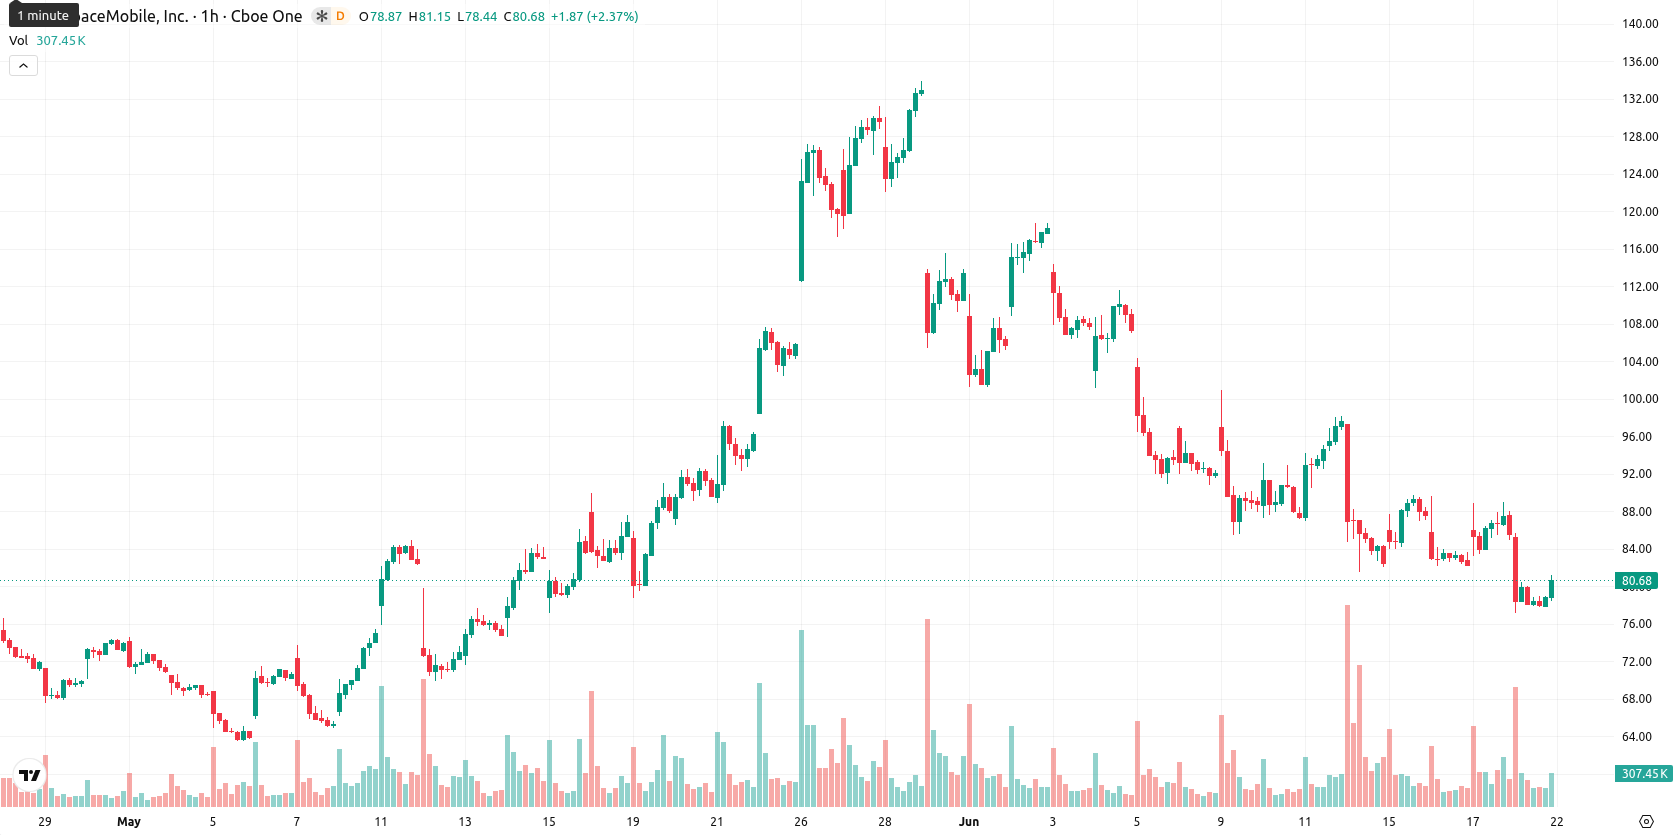
AST SpaceMobile (ASTS) stock is trading at $80.66, down 5.58% on the day and currently positioned below its key moving averages on short- and medium-term timeframes while holding just above the long-term average. Volatility remains elevated, and selling pressure has recently dominated price action.
Highlights
- AST SpaceMobile launched its BlueBird 8, 9, and 10 satellites, doubling peak data speeds for direct-to-device services.
- The company ended the quarter with $3 billion in cash, low short-term debt, and ongoing R&D expansion amid government sector pursuits.
- ASTS/USD faces near-term selling pressure with price expected to trade between $71.8 and $89.52, as momentum indicators remain predominantly bearish.
Reinforced capabilities and liquidity as Block 2 satellites launch
AST SpaceMobile completed the successful orbital deployment of its BlueBird 8, 9, and 10 satellites, described as the largest commercial communications arrays in low Earth orbit at roughly 2,400 square feet, according to Mobilesyrup. These new satellites are engineered to deliver nearly double the peak data speeds of earlier Block 1 models, enhancing direct-to-device service capabilities. The company is also actively pursuing ten government use cases in the United States across both communications and non-communications sectors. Financially, AST SpaceMobile ended the recent quarter with $3 billion in cash against short-term debt of $37.1 million and a continued increase in engineering and R&D investments, as reported by Barchart, though price action has remained under broader selling pressure.
Sell signals deepen below averages as momentum splinters
On the technical front, ASTS is trading below the MA-20 at $82.61 and MA-50 at $86.41 but remains marginally above the MA-200 at $80.46. The Ichimoku Kijun at $83.44 forms immediate resistance, while $71.8 serves as a key support level and $89.52 as a resistance cap in the current range. MACD confirms a Sell bias, and both RSI and CCI signal ongoing selling conditions, with Bull/Bear Power (BBP) strongly oversold. In contrast, ADX marks a neutral trend, and oscillators such as Stoch RSI and Awesome Oscillator (AO) give mixed or neutral signals, evidencing a fragmented momentum environment.
Downside bias prevails as resistance limits rebound odds
Looking ahead to the short term, ASTS is likely to fluctuate between $71.8 and $89.52 as its typical volatility band. The probability of a rebound above $83.44 resistance is limited at 25%, suggesting further downside risk dominates the near-term outlook. Should selling persist, a move toward $71.8 becomes increasingly likely, while any upside scenario would require a sustained break above current resistance levels.
Earlier, analysts noted that despite significant operational achievements, AST SpaceMobile’s shares remained under technical pressure with uncertain momentum. The latest developments reinforce this cautious outlook, and traders should monitor any decisive move below $71.8 as confirmation of heightened downside risk.


Latest AST SpaceMobile News


-
 Afghanistan
-
 Albania
-
 Algeria
-
 Angola
-
 Argentina
-
 Armenia
-
 Australia
-
 Austria
-
 Azerbaijan
-
 Bahamas
-
 Bahrain
-
 Bangladesh
-
 Belarus
-
 Belgium
-
 Bolivia
-
 Botswana
-
 Brazil
-
 Brunei
-
 Bulgaria
-
 Cambodia
-
 Cameroon
-
 Canada
-
 Chile
Chile
-
 China
China
-
 Colombia
-
 Congo
Congo
-
 Costa Rica
-
 Cote d'Ivoire
-
 Croatia
-
 Cuba
Cuba
-
 Cyprus
-
 Czechia
-
 DR Congo
-
 Denmark
-
 Dominican Republic
-
 Ecuador
-
 Egypt
Egypt
-
 El Salvador
-
 Estonia
-
 Eswatini
-
 Ethiopia
-
 Finland
-
 France
-
 Georgia
-
 Germany
-
 Ghana
Ghana
-
 Greece
-
 Haiti
Haiti
-
 Hong Kong
-
 Hungary
-
 India
India
-
 Indonesia
-
 Iran, Islamic republic
-
 Iraq
Iraq
-
 Ireland
-
 Israel
-
 Italy
Italy
-
 Jamaica
-
 Japan
Japan
-
 Jordan
-
 Kazakhstan
-
 Kenya
Kenya
-
 Korea
Korea
-
 Kuwait
-
 Kyrgyzstan
-
 Laos
Laos
-
 Latvia
-
 Lebanon
-
 Lesotho
-
 Libya
Libya
-
 Lithuania
-
 Luxembourg
-
 Madagascar
-
 Malaysia
-
 Malta
Malta
-
 Mauritius
-
 Mexico
-
 Moldova
-
 Mongolia
-
 Montenegro
-
 Morocco
-
 Mozambique
-
 Myanmar
-
 Namibia
-
 Nepal
Nepal
-
 Netherlands
-
 New Zealand
-
 Nigeria
-
 North Macedonia
-
 Norway
-
 Oman
Oman
-
 Pakistan
-
 Palestine
-
 Panama
-
 Papua New Guinea
-
 Paraguay
-
 Peru
Peru
-
 Philippines
-
 Poland
-
 Portugal
-
 Puerto Rico
-
 Qatar
Qatar
-
 Reunion
-
 Romania
-
 Rwanda
-
 Saudi Arabia
-
 Serbia
-
 Singapore
-
 Slovakia
-
 Slovenia
-
 Somalia
-
 South Africa
-
 Spain
Spain
-
 Sri Lanka
-
 Sweden
-
 Switzerland
-
 Syria
Syria
-
 Taiwan
-
 Tajikistan
-
 Tanzania
-
 Thailand
-
 Trinidad and Tobago
-
 Tunisia
-
 Turkey
-
 UAE
UAE
-
 Uganda
-
 Ukraine
-
 United Kingdom
-
United States
-
 Uruguay
-
 Uzbekistan
-
 Venezuela
-
 Vietnam
-
 Yemen
Yemen
-
 Zambia
-
 Zimbabwe
- Forex
- Crypto
