
Kimberly-Clark stock advances as operational and market share growth drives gains

Kimberly-Clark Corporation (KMB) stock is trading at $103.97, marking a daily advance of 3.45%. The price is positioned above its short- and medium-term moving averages and below its key long-term average at this level.
Highlights
- Kimberly-Clark's strong operational execution, including nine straight quarters of volume and share gains, drives a positive fundamental outlook.
- International sales growth in markets like Brazil, Indonesia, Vietnam, and Korea enhances revenue diversification and improves margins.
- Technically, short- and medium-term momentum is bullish with price targets between $101.91 and $106.03, though some indicators warn of possible overbought conditions.
Fundamental outlook improves as product innovation offsets insider selling
Kimberly-Clark's recent operational performance, including nine consecutive quarters of volume and share growth, major advancements in elevating Huggies to the premium tier in the U.S., and achievement of more than half its $3 billion productivity target, continues to underpin the company's fundamental outlook, according to Insidermonkey. This strong execution, complemented by double-digit sales expansion in international regions such as Brazil, Indonesia, Vietnam, and Korea, directly boosts revenue diversification and margin improvement. Further momentum arises from the Pull-Ups brand's launch of Learning Layer technology in Canada, indicating ongoing product innovation, while recent share sales by HSBC Holdings PLC represent a modest counterbalance against otherwise constructive business trends.
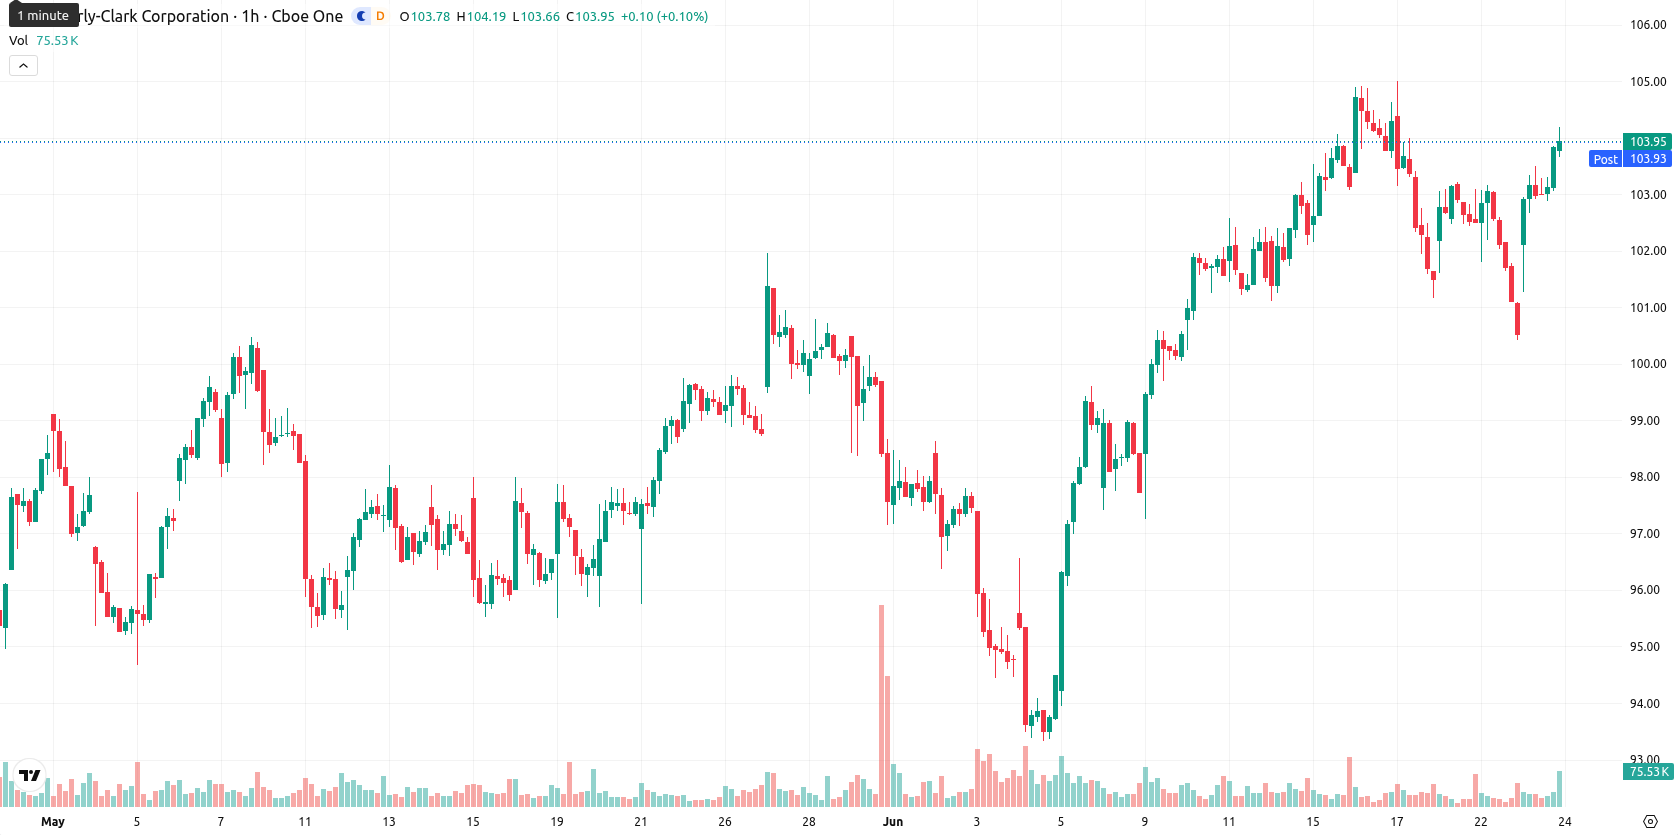
Divergence among momentum signals as price straddles key averages
The H1 chart for KMB shows price levels above both the MA-20 ($102.56) and MA-50 ($102.85), while the daily timeframe places KMB below its MA-200 ($105.67). Immediate support is defined by the Ichimoku Kijun at $102.21. The Relative Strength Index (RSI) reads 54.79 with a Buy indication, and the Commodity Channel Index (CCI) also posts a Buy. Stoch RSI is positioned in the Overbought zone. Both the MACD and ADX are Neutral, while Bull/Bear Power (BBP) favors buyers. The Awesome Oscillator (AO) signals Strong Buy, though there is divergence among oscillators as not all momentum indicators confirm the strength of the rally.
Upside consolidation favored unless support breach triggers downside risk
For the next 2 6 trading days, the expected trading range for KMB is $101.91 to $106.03, representing a volatility band relative to current levels. The baseline scenario suggests price consolidation within this corridor. Upside continuation is highly probable, with a breakout above resistance likely to drive KMB toward the range high, while a downturn becomes a risk only if support at $102.21 is breached.
Earlier, analysts noted that Kimberly-Clark was in a short-term technical rebound within a longer-term downtrend, supported by improved earnings and renewed institutional interest. Recent operational milestones and expanding international sales now reinforce that bullish momentum, making the $105.67 level a critical threshold to watch for sustained upside beyond the current consolidation zone.


Latest Kimberly-Clark News


-
 Afghanistan
-
 Albania
-
 Algeria
-
 Angola
-
 Argentina
-
 Armenia
-
 Australia
-
 Austria
-
 Azerbaijan
-
 Bahamas
-
 Bahrain
-
 Bangladesh
-
 Belarus
-
 Belgium
-
 Bolivia
-
 Botswana
-
 Brazil
-
 Brunei
-
 Bulgaria
-
 Cambodia
-
 Cameroon
-
 Canada
-
 Chile
Chile
-
 China
China
-
 Colombia
-
 Congo
Congo
-
 Costa Rica
-
 Cote d'Ivoire
-
 Croatia
-
 Cuba
Cuba
-
 Cyprus
-
 Czechia
-
 DR Congo
-
 Denmark
-
 Dominican Republic
-
 Ecuador
-
 Egypt
Egypt
-
 El Salvador
-
 Estonia
-
 Eswatini
-
 Ethiopia
-
 Finland
-
 France
-
 Georgia
-
 Germany
-
 Ghana
Ghana
-
 Greece
-
 Haiti
Haiti
-
 Hong Kong
-
 Hungary
-
 India
India
-
 Indonesia
-
 Iran, Islamic republic
-
 Iraq
Iraq
-
 Ireland
-
 Israel
-
 Italy
Italy
-
 Jamaica
-
 Japan
Japan
-
 Jordan
-
 Kazakhstan
-
 Kenya
Kenya
-
 Korea
Korea
-
 Kuwait
-
 Kyrgyzstan
-
 Laos
Laos
-
 Latvia
-
 Lebanon
-
 Lesotho
-
 Libya
Libya
-
 Lithuania
-
 Luxembourg
-
 Madagascar
-
 Malaysia
-
 Malta
Malta
-
 Mauritius
-
 Mexico
-
 Moldova
-
 Mongolia
-
 Montenegro
-
 Morocco
-
 Mozambique
-
 Myanmar
-
 Namibia
-
 Nepal
Nepal
-
 Netherlands
-
 New Zealand
-
 Nigeria
-
 North Macedonia
-
 Norway
-
 Oman
Oman
-
 Pakistan
-
 Palestine
-
 Panama
-
 Papua New Guinea
-
 Paraguay
-
 Peru
Peru
-
 Philippines
-
 Poland
-
 Portugal
-
 Puerto Rico
-
 Qatar
Qatar
-
 Reunion
-
 Romania
-
 Rwanda
-
 Saudi Arabia
-
 Serbia
-
 Singapore
-
 Slovakia
-
 Slovenia
-
 Somalia
-
 South Africa
-
 Spain
Spain
-
 Sri Lanka
-
 Sweden
-
 Switzerland
-
 Syria
Syria
-
 Taiwan
-
 Tajikistan
-
 Tanzania
-
 Thailand
-
 Trinidad and Tobago
-
 Tunisia
-
 Turkey
-
 UAE
UAE
-
 Uganda
-
 Ukraine
-
 United Kingdom
-
United States
-
 Uruguay
-
 Uzbekistan
-
 Venezuela
-
 Vietnam
-
 Yemen
Yemen
-
 Zambia
-
 Zimbabwe
- Forex
- Crypto
