
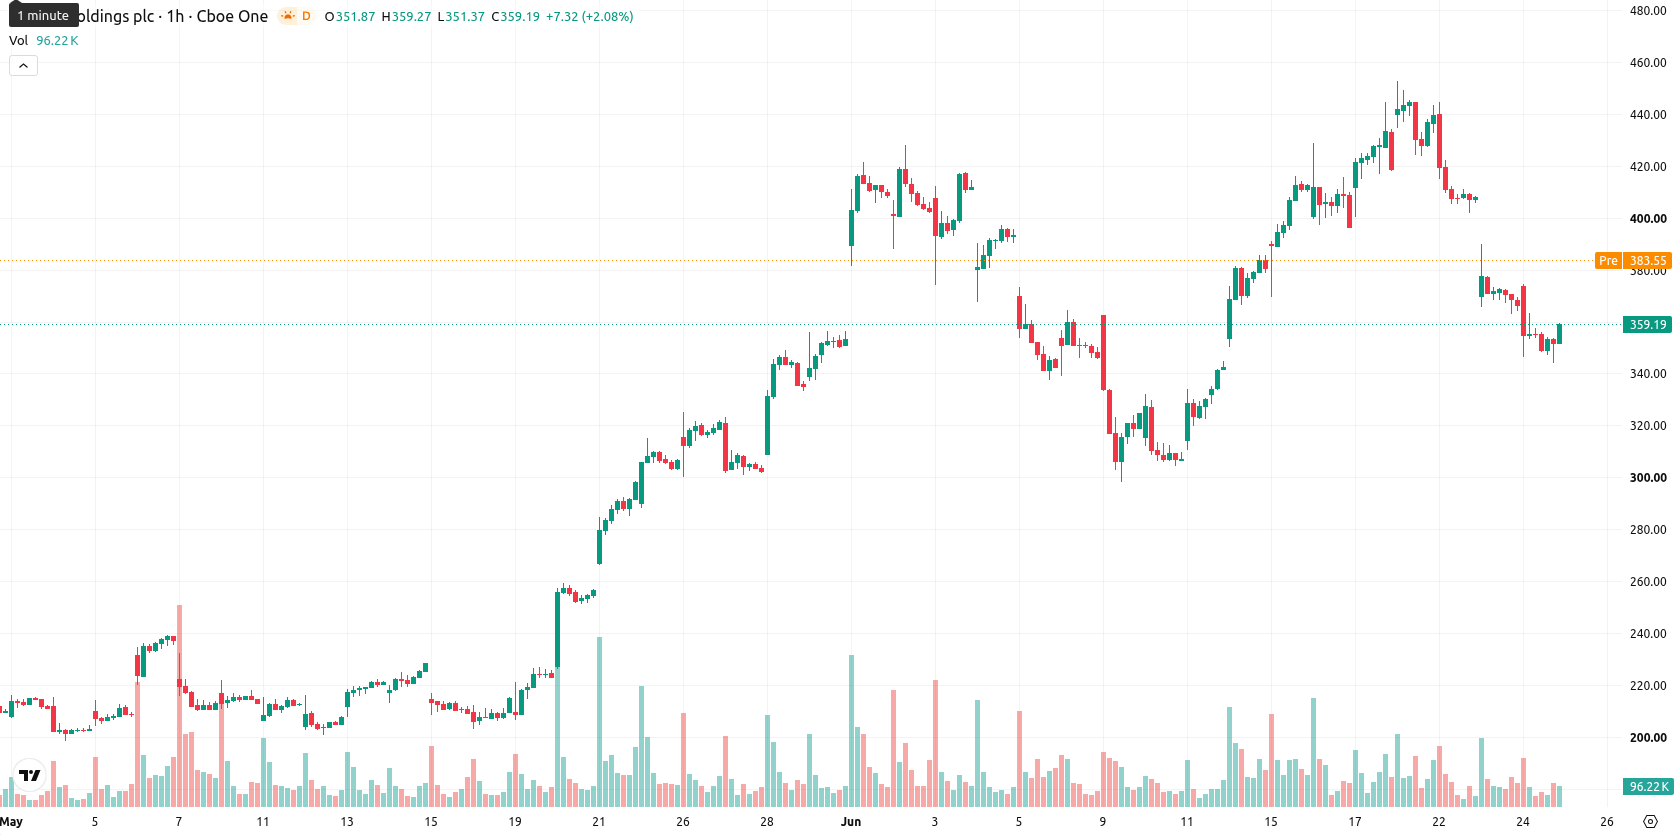
Buying exhaustion limits further downside for Arm stock at $359.08

Arm (ARM) stock is trading at $359.08, down 2% on the day as it trends below its key moving averages. The current price is below its short- and medium-term averages while remaining comfortably above its long-term support threshold.
Highlights
- SoftBank's CEO reaffirmed Arm's position as a key chip supplier and confirmed SoftBank's 86.39% controlling stake.
- Arm's strategic value and long-term outlook are supported by its ongoing alignment and partnership with SoftBank.
- Arm's shares remain under short- and medium-term bearish pressure, with a likely trading range of $311.38 to $406.78 and a 61% probability of further downside.
SoftBank backing reinforces long-term outlook despite pressure on shares
SoftBank Group Corp.'s CEO Masayoshi Son stated on Wednesday that Arm Holdings is positioned to become one of the world's most important chip suppliers and confirmed SoftBank's controlling 86.39% ownership, according to Tradingview. This direct endorsement from the parent company underscores Arm's strategic significance in the semiconductor industry and is likely to support longer-term confidence in its business outlook. The ongoing partnership with SoftBank remains a key factor shaping market perception, though price action has remained under broader selling pressure.
Mixed signals emerge as key resistance holds amid seller dominance
On the technical front, ARM faces near-term pressure below the 20-day moving average at $376.46 and the 50-day moving average at $400.69, with the 200-day moving average at $171.47 providing deep structural support. The Ichimoku Kijun resistance stands at $394.69. Momentum indicators present a mixed short-term picture: the Moving Average Convergence Divergence (MACD) and Average Directional Index (ADX) both signal a sell bias, while the Relative Strength Index (RSI) is oversold at 35.27 and the Commodity Channel Index (CCI) also reads oversold. However, Stochastic RSI suggests overbought conditions, revealing a clear divergence among oscillators. Bull/Bear Power indicates sellers dominate the session, and the Awesome Oscillator remains neutral, highlighting uncertainty in intraday sentiment.
Consolidation expected as bearish risks outweigh bullish breakout
In the short term, ARM is expected to trade within a volatility band between $311.38 and $406.78. Forecast models assign a 61% likelihood of further downside and a 39% probability of an upward move in the coming sessions. The baseline scenario sees price consolidating within this corridor, while a break above $394.69 could trigger a bullish acceleration. Conversely, a move below $311.38 support would likely result in additional selling momentum.
Previously it was reported that Arm’s strong long-term fundamentals were being tested by sustained selling pressure and heightened volatility. The current landscape reinforces this cautious outlook, as diverging momentum signals and persistent downside risk suggest that traders should closely monitor whether Arm can defend its $311.38 support or stage a reversal toward the upper end of its volatility band.


-
 Afghanistan
-
 Albania
-
 Algeria
-
 Angola
-
 Argentina
-
 Armenia
-
 Australia
-
 Austria
-
 Azerbaijan
-
 Bahamas
-
 Bahrain
-
 Bangladesh
-
 Belarus
-
 Belgium
-
 Bolivia
-
 Botswana
-
 Brazil
-
 Brunei
-
 Bulgaria
-
 Cambodia
-
 Cameroon
-
 Canada
-
 Chile
Chile
-
 China
China
-
 Colombia
-
 Congo
Congo
-
 Costa Rica
-
 Cote d'Ivoire
-
 Croatia
-
 Cuba
Cuba
-
 Cyprus
-
 Czechia
-
 DR Congo
-
 Denmark
-
 Dominican Republic
-
 Ecuador
-
 Egypt
Egypt
-
 El Salvador
-
 Estonia
-
 Eswatini
-
 Ethiopia
-
 Finland
-
 France
-
 Georgia
-
 Germany
-
 Ghana
Ghana
-
 Greece
-
 Haiti
Haiti
-
 Hong Kong
-
 Hungary
-
 India
India
-
 Indonesia
-
 Iran, Islamic republic
-
 Iraq
Iraq
-
 Ireland
-
 Israel
-
 Italy
Italy
-
 Jamaica
-
 Japan
Japan
-
 Jordan
-
 Kazakhstan
-
 Kenya
Kenya
-
 Korea
Korea
-
 Kuwait
-
 Kyrgyzstan
-
 Laos
Laos
-
 Latvia
-
 Lebanon
-
 Lesotho
-
 Libya
Libya
-
 Lithuania
-
 Luxembourg
-
 Madagascar
-
 Malaysia
-
 Malta
Malta
-
 Mauritius
-
 Mexico
-
 Moldova
-
 Mongolia
-
 Montenegro
-
 Morocco
-
 Mozambique
-
 Myanmar
-
 Namibia
-
 Nepal
Nepal
-
 Netherlands
-
 New Zealand
-
 Nigeria
-
 North Macedonia
-
 Norway
-
 Oman
Oman
-
 Pakistan
-
 Palestine
-
 Panama
-
 Papua New Guinea
-
 Paraguay
-
 Peru
Peru
-
 Philippines
-
 Poland
-
 Portugal
-
 Puerto Rico
-
 Qatar
Qatar
-
 Reunion
-
 Romania
-
 Rwanda
-
 Saudi Arabia
-
 Serbia
-
 Singapore
-
 Slovakia
-
 Slovenia
-
 Somalia
-
 South Africa
-
 Spain
Spain
-
 Sri Lanka
-
 Sweden
-
 Switzerland
-
 Syria
Syria
-
 Taiwan
-
 Tajikistan
-
 Tanzania
-
 Thailand
-
 Trinidad and Tobago
-
 Tunisia
-
 Turkey
-
 UAE
UAE
-
 Uganda
-
 Ukraine
-
 United Kingdom
-
United States
-
 Uruguay
-
 Uzbekistan
-
 Venezuela
-
 Vietnam
-
 Yemen
Yemen
-
 Zambia
-
 Zimbabwe
- Forex
- Crypto
