

-3.99% for AMD stock as ETF sector rotation shakes confidence

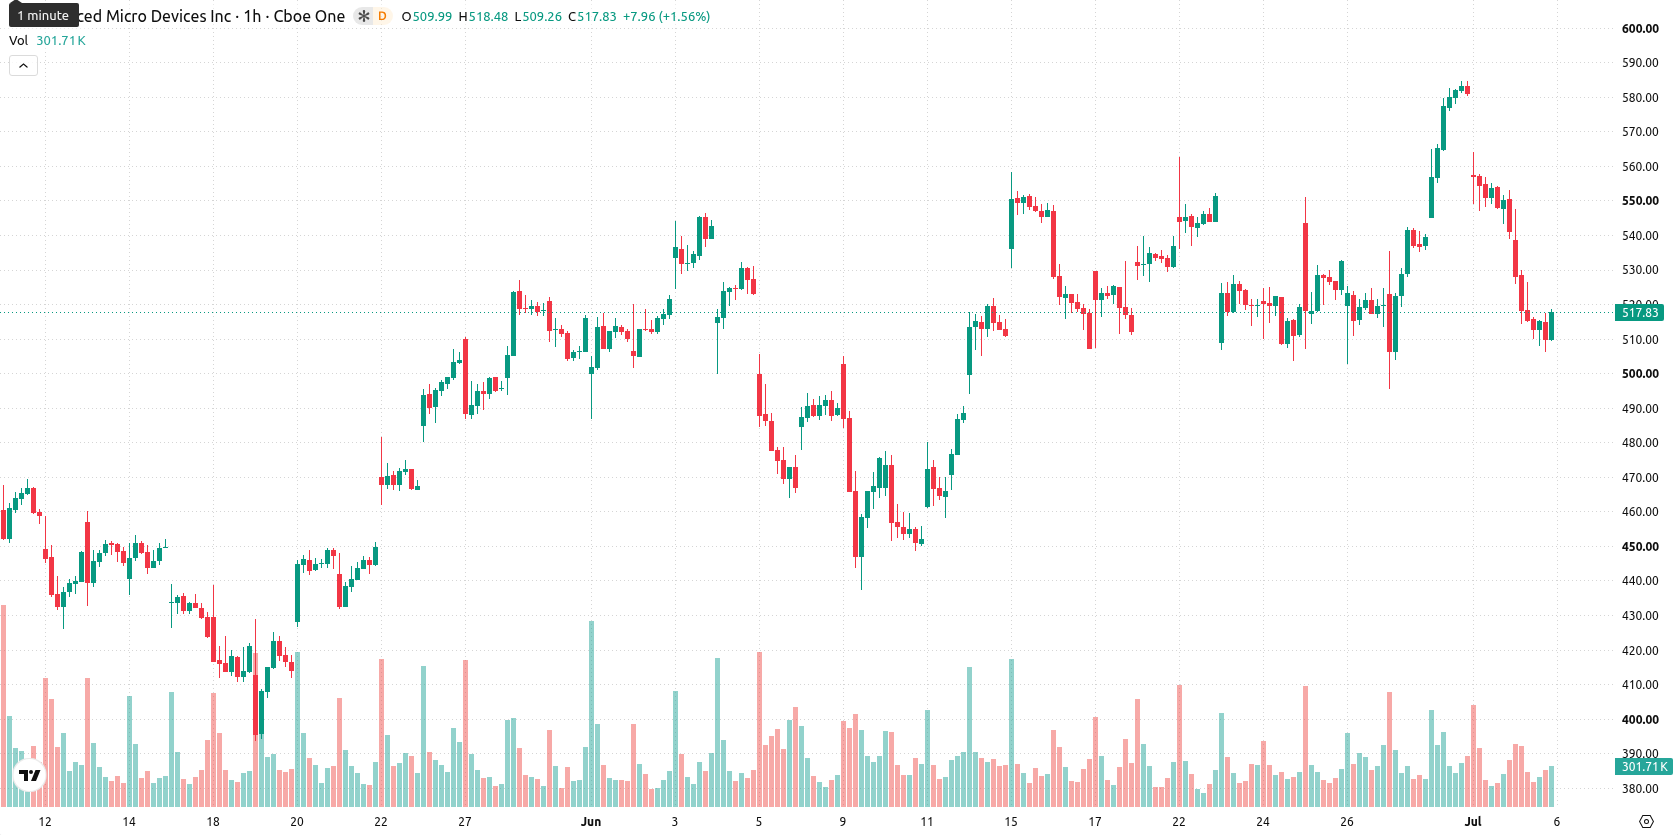
AMD (AMD) stock is trading at $519.32, down 3.99% on the day, with the move taking place below its key short- and medium-term moving averages while remaining above long-term trend levels.
 606.18
647.86
606.18
647.86
Highlights
- AMD's stock is highly exposed to passive flows, comprising 7-8% of large sector ETFs like SOXX and ARKQ, amplifying its sensitivity to ETF trading dynamics.
- This ETF-driven concentration increases AMD's susceptibility to liquidity-driven price swings and sector rotation, intensifying volatility during major capital shifts.
- Short- and medium-term technicals remain bearish with high volatility, projecting a probable sideways to lower trade between $479.35 and $559.29 over the next several days.
Liquidity swings rise as major ETF exposure compounds rebalancing risk
As reported by Trefis on July 2, 2026, Advanced Micro Devices stands out as a significant component in several large equity funds, such as the iShares Semiconductor ETF (SOXX) and the ARK Autonomous Technology & Robotics ETF (ARKQ), where it accounts for roughly 7-8% of portfolio holdings. This concentrated exposure to major funds increases AMD's linkage to passive investment flows, amplifying its sensitivity to ETF rebalancing and sector rotation. These dynamics can heighten liquidity-driven price swings as large capital movements in ETFs directly affect AMD's stock, though price action has remained under broader selling pressure.
Bearish bias dominates as multiple signals weigh against potential bounce
Technically, AMD is trading below the MA-20 at $547.05 and MA-50 at $533.88 on the H1 chart, while staying well above the MA-200 at $278.16. The Ichimoku Kijun level at $545.37 represents the immediate resistance to upside attempts. The Moving Average Convergence Divergence (MACD) and Average Directional Index (ADX) maintain negative readings, supporting near-term weakness. The Relative Strength Index (RSI) is at 40, indicating a sell signal, while the Commodity Channel Index (CCI) and Bull/Bear Power are both in oversold territory, signaling dominant selling activity intraday. In contrast, the Stochastic RSI shows a strong buy, suggesting some potential for a rebound. The Awesome Oscillator further validates the prevailing downside momentum, but emerging oscillator divergence hints that a short-term relief bounce is possible.
Downside favored as range trading defines near-term outlook
For the coming days, forecasts indicate AMD may trade within a volatility band between $479.35 and $559.29. A further decline is currently the higher-probability outcome (61%), with a 39% chance of a rebound. The baseline expectation is for sideways movement inside this range. Should AMD decisively reclaim levels above $545.37, a move towards the upper end of the band becomes more likely, while a break below $479.35 would open scope for another downward leg.
Previously it was reported that AMD faced elevated correction risk and increased uncertainty as technical signals turned mixed following a rapid valuation rally. The current analysis reinforces this cautious outlook, with downside momentum persisting amid ETF-driven volatility, making a sustained close above $545.37 an important signal for a potential shift toward recovery.











-
 Afghanistan
-
 Albania
-
 Algeria
-
 Angola
-
 Argentina
-
 Armenia
-
 Australia
-
 Austria
-
 Azerbaijan
-
 Bahamas
-
 Bahrain
-
 Bangladesh
-
 Belarus
-
 Belgium
-
 Bolivia
-
 Botswana
-
 Brazil
-
 Brunei
-
 Bulgaria
-
 Cambodia
-
 Cameroon
-
 Canada
-
 Chile
Chile
-
 China
China
-
 Colombia
-
 Congo
Congo
-
 Costa Rica
-
 Cote d'Ivoire
-
 Croatia
-
 Cuba
Cuba
-
 Cyprus
-
 Czechia
-
 DR Congo
-
 Denmark
-
 Dominican Republic
-
 Ecuador
-
 Egypt
Egypt
-
 El Salvador
-
 Estonia
-
 Eswatini
-
 Ethiopia
-
 Finland
-
 France
-
 Georgia
-
 Germany
-
 Ghana
Ghana
-
 Greece
-
 Haiti
Haiti
-
 Hong Kong
-
 Hungary
-
 India
India
-
 Indonesia
-
 Iran, Islamic republic
-
 Iraq
Iraq
-
 Ireland
-
 Israel
-
 Italy
Italy
-
 Jamaica
-
 Japan
Japan
-
 Jordan
-
 Kazakhstan
-
 Kenya
Kenya
-
 Korea
Korea
-
 Kuwait
-
 Kyrgyzstan
-
 Laos
Laos
-
 Latvia
-
 Lebanon
-
 Lesotho
-
 Libya
Libya
-
 Lithuania
-
 Luxembourg
-
 Madagascar
-
 Malaysia
-
 Malta
Malta
-
 Mauritius
-
 Mexico
-
 Moldova
-
 Mongolia
-
 Montenegro
-
 Morocco
-
 Mozambique
-
 Myanmar
-
 Namibia
-
 Nepal
Nepal
-
 Netherlands
-
 New Zealand
-
 Nigeria
-
 North Macedonia
-
 Norway
-
 Oman
Oman
-
 Pakistan
-
 Palestine
-
 Panama
-
 Papua New Guinea
-
 Paraguay
-
 Peru
Peru
-
 Philippines
-
 Poland
-
 Portugal
-
 Puerto Rico
-
 Qatar
Qatar
-
 Reunion
-
 Romania
-
 Rwanda
-
 Saudi Arabia
-
 Serbia
-
 Singapore
-
 Slovakia
-
 Slovenia
-
 Somalia
-
 South Africa
-
 Spain
Spain
-
 Sri Lanka
-
 Sweden
-
 Switzerland
-
 Syria
Syria
-
 Taiwan
-
 Tajikistan
-
 Tanzania
-
 Thailand
-
 Trinidad and Tobago
-
 Tunisia
-
 Turkey
-
 UAE
UAE
-
 Uganda
-
 Ukraine
-
 United Kingdom
-
United States
-
 Uruguay
-
 Uzbekistan
-
 Venezuela
-
 Vietnam
-
 Yemen
Yemen
-
 Zambia
-
 Zimbabwe
- Forex
- Crypto












