
Arm Holdings stock outlook: Support test as sellers dominate

Arm Holdings (ARM) stock is trading at $281.17, down 5.96% on the day. The shares are currently positioned below their key moving averages.
 276.33
310.50
276.33
310.50
Highlights
- Arm Holdings shares faced increased selling due to sector-wide profit taking and concerns about slowing royalty growth.
- Investor sentiment worsened as rising Treasury yields and intensifying competition from open-source RISC-V architectures pressured Arm's valuation.
- Technical signals remain strongly bearish with active seller momentum, and price is expected to consolidate between $253.08 and $309.26 with elevated downside risk.
Valuation pressures rise amid sector rotation and royalty concerns
Sector-wide profit-taking led to increased selling in Arm Holdings shares, with the move exacerbated by company-specific worries over slowing royalty growth, according to Tradingkey. Additional pressure resulted from the rise in long-term Treasury yields, which heightened discount rate sensitivities and weighed on valuations for growth-oriented technology firms. Tradingkey also cited intensifying competition from open-source RISC-V architectures as further undermining sentiment toward the stock.
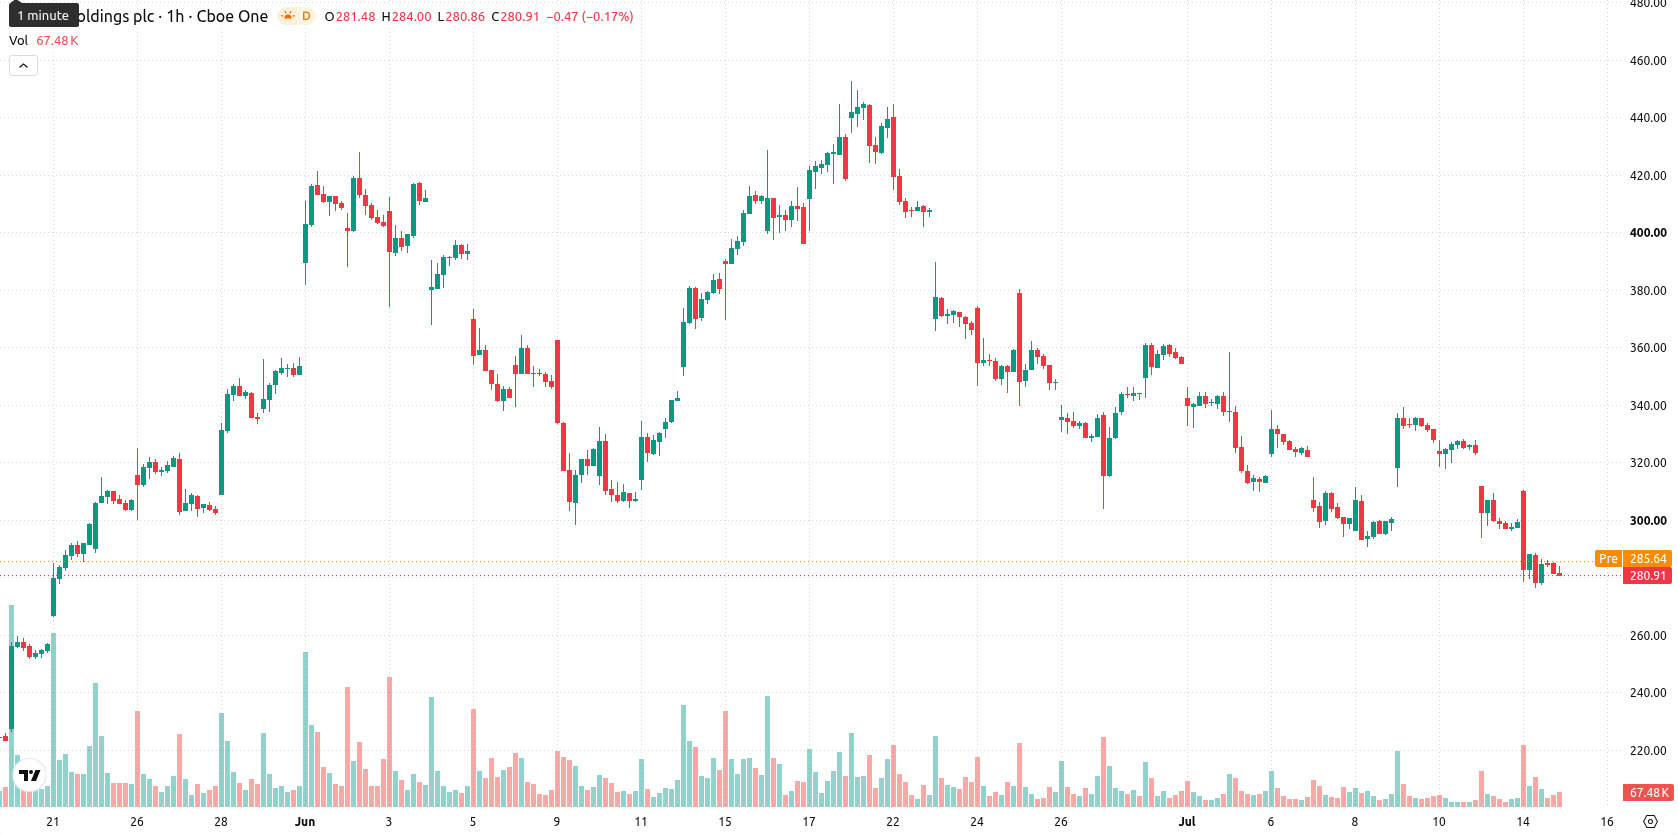
Bearish momentum persists as sellers dominate below resistance
On the H1 chart, ARM is trading below its 20-period moving average at $301.90 and its 50-period moving average at $309.93, while remaining above the 200-period moving average on the daily timeframe at $182.81. Ichimoku Kijun resistance is established at $305.95. Momentum indicators are negative: the Moving Average Convergence Divergence (MACD) and the Average Directional Index (ADX) both reflect a clear sell bias. The Relative Strength Index (RSI) sits at 33.47 and the Commodity Channel Index (CCI) has moved into sell territory, while Bull/Bear Power is oversold—each pointing to persistent intraday seller dominance. Stochastic RSI is neutral, and the Awesome Oscillator currently shows no clear directional bias. Volatility remains high with price activity near the session low.
Further downside risk as lower band consolidation persists
In the short term, ARM is expected to trade within a volatility range of $253.08 to $309.26. Statistical probabilities strongly favor further downside, making an upside move less likely based on current price dynamics. The baseline scenario features price consolidation around the lower end of this band. Should a rebound occur, a breakout above $305.95 immediate resistance would be required to shift the short-term outlook bullish, while a break below support near $253.08 could trigger further downside momentum.
Earlier, analysts noted that Arm Holdings faced persistent short-term selling pressure due to sector volatility and concerns about its valuation. The current deterioration in royalty growth trends and mounting competition from open-source alternatives further heighten downside risks, making monitoring price stability near $253 crucial for gauging whether the short-term bearish momentum will intensify or stabilize.








-
 Afghanistan
-
 Albania
-
 Algeria
-
 Angola
-
 Argentina
-
 Armenia
-
 Australia
-
 Austria
-
 Azerbaijan
-
 Bahamas
-
 Bahrain
-
 Bangladesh
-
 Belarus
-
 Belgium
-
 Bolivia
-
 Botswana
-
 Brazil
-
 Brunei
-
 Bulgaria
-
 Cambodia
-
 Cameroon
-
 Canada
-
 Chile
Chile
-
 China
China
-
 Colombia
-
 Congo
Congo
-
 Costa Rica
-
 Cote d'Ivoire
-
 Croatia
-
 Cuba
Cuba
-
 Cyprus
-
 Czechia
-
 DR Congo
-
 Denmark
-
 Dominican Republic
-
 Ecuador
-
 Egypt
Egypt
-
 El Salvador
-
 Estonia
-
 Eswatini
-
 Ethiopia
-
 Finland
-
 France
-
 Georgia
-
 Germany
-
 Ghana
Ghana
-
 Greece
-
 Haiti
Haiti
-
 Hong Kong
-
 Hungary
-
 India
India
-
 Indonesia
-
 Iran, Islamic republic
-
 Iraq
Iraq
-
 Ireland
-
 Israel
-
 Italy
Italy
-
 Jamaica
-
 Japan
Japan
-
 Jordan
-
 Kazakhstan
-
 Kenya
Kenya
-
 Korea
Korea
-
 Kuwait
-
 Kyrgyzstan
-
 Laos
Laos
-
 Latvia
-
 Lebanon
-
 Lesotho
-
 Libya
Libya
-
 Lithuania
-
 Luxembourg
-
 Madagascar
-
 Malaysia
-
 Malta
Malta
-
 Mauritius
-
 Mexico
-
 Moldova
-
 Mongolia
-
 Montenegro
-
 Morocco
-
 Mozambique
-
 Myanmar
-
 Namibia
-
 Nepal
Nepal
-
 Netherlands
-
 New Zealand
-
 Nigeria
-
 North Macedonia
-
 Norway
-
 Oman
Oman
-
 Pakistan
-
 Palestine
-
 Panama
-
 Papua New Guinea
-
 Paraguay
-
 Peru
Peru
-
 Philippines
-
 Poland
-
 Portugal
-
 Puerto Rico
-
 Qatar
Qatar
-
 Reunion
-
 Romania
-
 Rwanda
-
 Saudi Arabia
-
 Serbia
-
 Singapore
-
 Slovakia
-
 Slovenia
-
 Somalia
-
 South Africa
-
 Spain
Spain
-
 Sri Lanka
-
 Sweden
-
 Switzerland
-
 Syria
Syria
-
 Taiwan
-
 Tajikistan
-
 Tanzania
-
 Thailand
-
 Trinidad and Tobago
-
 Tunisia
-
 Turkey
-
 UAE
UAE
-
 Uganda
-
 Ukraine
-
 United Kingdom
-
United States
-
 Uruguay
-
 Uzbekistan
-
 Venezuela
-
 Vietnam
-
 Yemen
Yemen
-
 Zambia
-
 Zimbabwe
- Forex
- Crypto











