
Why is Microsoft stock down today? Weak momentum and next price targets to watch

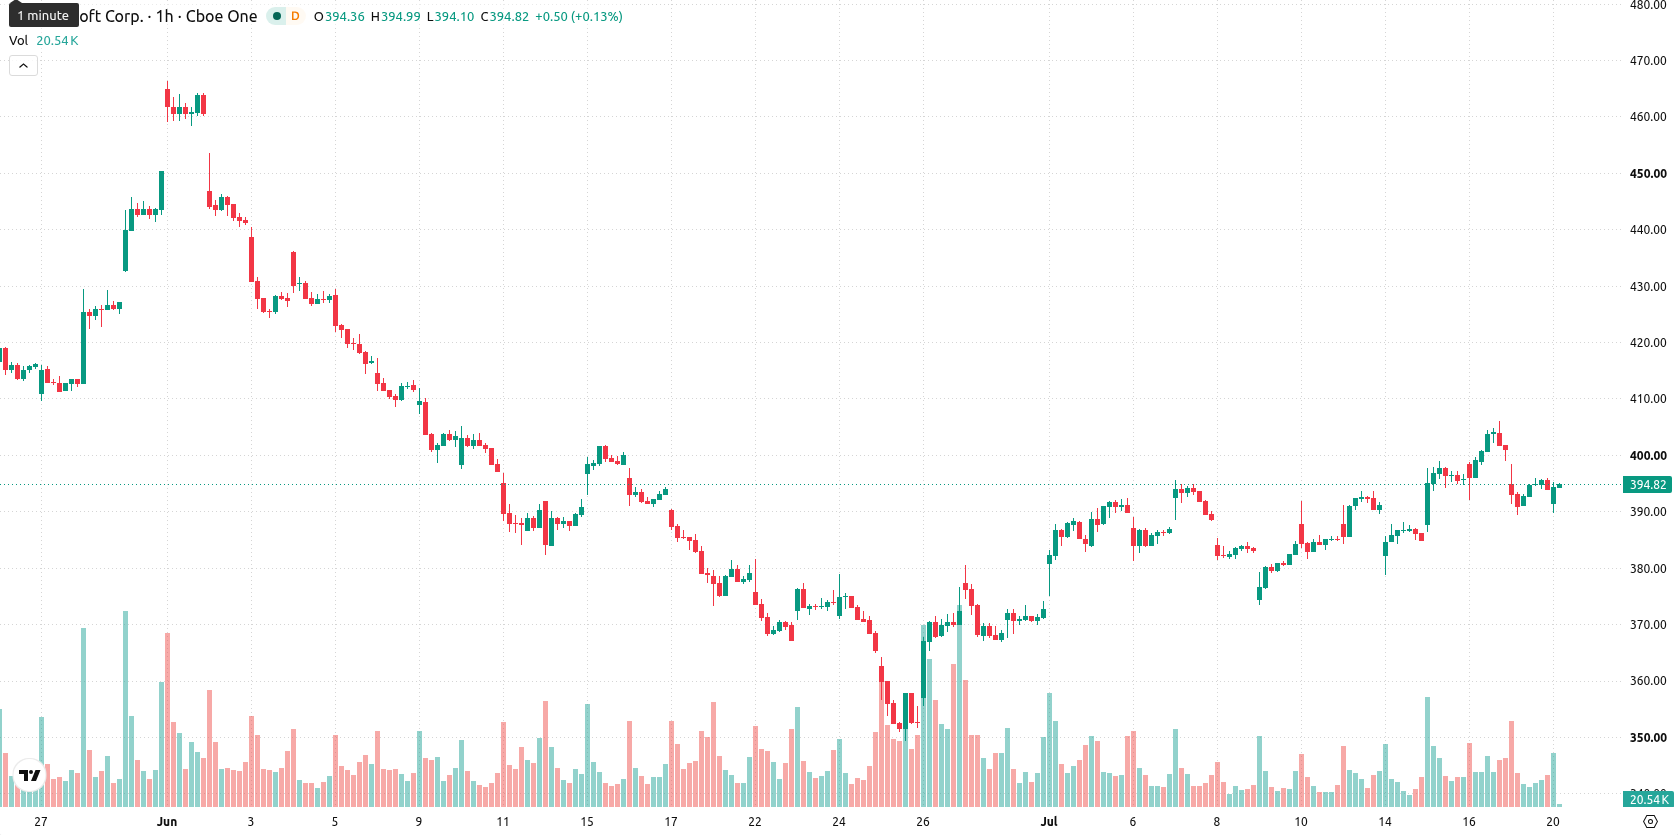
Microsoft (MSFT) stock is trading at $393.82 after sliding 1.82% on the day. The stock remains below its short-term moving average and above the medium-term average, while staying well under its long-term trend levels.
 394.14
401.47
394.14
401.47
Highlights
- Microsoft broadened Anthropic AI model integration across Copilot and Foundry, with Copilot surpassing 20 million paid enterprise seats.
- A new partnership with 3M brings Expanded Beam Optical tech to Azure data centers and advances adoption of Microsoft AI in 3M's operations.
- MSFT trades below key short-term averages amid mixed momentum, expecting a consolidation range between $381.59 and $406.05 in coming sessions.
AI integration and cloud deals advance as selling pressure lingers
Microsoft has expanded the integration of Anthropic models across its Copilot and Foundry platforms, with Copilot surpassing 20 million paid seats, according to Tradingview. This development reflects ongoing progress in incorporating advanced AI capabilities into Microsoft's enterprise ecosystem, potentially increasing the platform’s value proposition and user base. Additionally, the company announced a partnership with 3M for Azure Cloud to enable deployment of Expanded Beam Optical technology in data centers, while 3M will adopt Microsoft AI solutions across business functions. These actions highlight concrete steps in strengthening Microsoft's AI and cloud service offerings, though price action has remained under broader selling pressure.
Mixed signals with resistance holding amid oversold momentum
MSFT is trading below its MA-20 and above its MA-50 on the H1 chart, while staying well below the MA-200, indicating short- and medium-term selling pressure and a bearish longer-term backdrop. The Ichimoku Kijun sits at $395.36, acting as immediate resistance. MACD shows strong buy interest but is contradicted by a neutral ADX and a RSI at 48.22 with a Sell signal. Stochastic RSI and Bull/Bear Power suggest an oversold intraday state with selling dominance, while CCI also leans bearish. Awesome Oscillator remains neutral, contributing no clear trend bias.
Rangebound outlook as breakout and breakdown scenarios compete
In the short term, MSFT is anticipated to consolidate within the $381.59 to $406.05 range, which aligns with typical volatility for the stock at current levels. The probability of upward movement stands at 53%, making a modest move higher slightly more likely, although both scenarios remain possible given diverging momentum signals. A bullish scenario would require a confirmed breakout above resistance at $395.36, while a close below $381.59 would likely reinforce a bearish continuation.
Earlier, analysts noted that Microsoft faced heightened investor caution and subdued technical momentum amid ongoing legal headwinds. The current landscape introduces new strategic partnerships and AI advancements, yet with mixed indicator signals and persistent selling pressure, traders should closely monitor for a confirmed breakout above $395.36 as a potential inflection point.


Latest Microsoft News






-
 Afghanistan
-
 Albania
-
 Algeria
-
 Angola
-
 Argentina
-
 Armenia
-
 Australia
-
 Austria
-
 Azerbaijan
-
 Bahamas
-
 Bahrain
-
 Bangladesh
-
 Belarus
-
 Belgium
-
 Bolivia
-
 Botswana
-
 Brazil
-
 Brunei
-
 Bulgaria
-
 Cambodia
-
 Cameroon
-
 Canada
-
 Chile
Chile
-
 China
China
-
 Colombia
-
 Congo
Congo
-
 Costa Rica
-
 Cote d'Ivoire
-
 Croatia
-
 Cuba
Cuba
-
 Cyprus
-
 Czechia
-
 DR Congo
-
 Denmark
-
 Dominican Republic
-
 Ecuador
-
 Egypt
Egypt
-
 El Salvador
-
 Estonia
-
 Eswatini
-
 Ethiopia
-
 Finland
-
 France
-
 Georgia
-
 Germany
-
 Ghana
Ghana
-
 Greece
-
 Haiti
Haiti
-
 Hong Kong
-
 Hungary
-
 India
India
-
 Indonesia
-
 Iran, Islamic republic
-
 Iraq
Iraq
-
 Ireland
-
 Israel
-
 Italy
Italy
-
 Jamaica
-
 Japan
Japan
-
 Jordan
-
 Kazakhstan
-
 Kenya
Kenya
-
 Korea
Korea
-
 Kuwait
-
 Kyrgyzstan
-
 Laos
Laos
-
 Latvia
-
 Lebanon
-
 Lesotho
-
 Libya
Libya
-
 Lithuania
-
 Luxembourg
-
 Madagascar
-
 Malaysia
-
 Malta
Malta
-
 Mauritius
-
 Mexico
-
 Moldova
-
 Mongolia
-
 Montenegro
-
 Morocco
-
 Mozambique
-
 Myanmar
-
 Namibia
-
 Nepal
Nepal
-
 Netherlands
-
 New Zealand
-
 Nigeria
-
 North Macedonia
-
 Norway
-
 Oman
Oman
-
 Pakistan
-
 Palestine
-
 Panama
-
 Papua New Guinea
-
 Paraguay
-
 Peru
Peru
-
 Philippines
-
 Poland
-
 Portugal
-
 Puerto Rico
-
 Qatar
Qatar
-
 Reunion
-
 Romania
-
 Rwanda
-
 Saudi Arabia
-
 Serbia
-
 Singapore
-
 Slovakia
-
 Slovenia
-
 Somalia
-
 South Africa
-
 Spain
Spain
-
 Sri Lanka
-
 Sweden
-
 Switzerland
-
 Syria
Syria
-
 Taiwan
-
 Tajikistan
-
 Tanzania
-
 Thailand
-
 Trinidad and Tobago
-
 Tunisia
-
 Turkey
-
 UAE
UAE
-
 Uganda
-
 Ukraine
-
 United Kingdom
-
United States
-
 Uruguay
-
 Uzbekistan
-
 Venezuela
-
 Vietnam
-
 Yemen
Yemen
-
 Zambia
-
 Zimbabwe
- Forex
- Crypto












