
META stock drops to the bottom of its recent range as MACD signals bearish momentum: weekly outlook

Meta Platforms, Inc. (META, formerly Facebook, Inc.) is currently trading at $609.07 and has declined $34.03, or 5.29%, over the past week. The stock is resting almost exactly at its weekly MA-20 ($608.86), positioned well below the MA-50 ($653.38), and remains significantly above the MA-200 ($476.19), reflecting medium-term seller pressure with longer-term support intact.
 609.36
655.88
609.36
655.88
Highlights
- META trades near the bottom of its weekly range at $609.07, reflecting a 5% decline over the past week amid elevated volatility.
- Technical signals are mixed; weekly momentum indicators point bearish, but oscillators are neutral to mildly oversold, suggesting potential for short-term stabilization.
- Expected trading range is $579 to $639 this week, with sideways movement likely unless support or resistance is decisively breached.
Earnings anticipation and cloud-AI partnerships drive sentiment during the week
Meta is set to report its second-quarter earnings on July 29, an event closely watched due to the company's expanding AI and cloud initiatives. The ongoing negotiations for a potential $10 billion cloud-compute agreement with Anthropic could strengthen Meta's position as a leading cloud provider. Additional highlights include continued investment in AI, the recent release of Ray-Ban Meta AI glasses in new markets, and strategic hires from Amazon Web Services, reinforcing its focus on scaling cloud and AI operations.
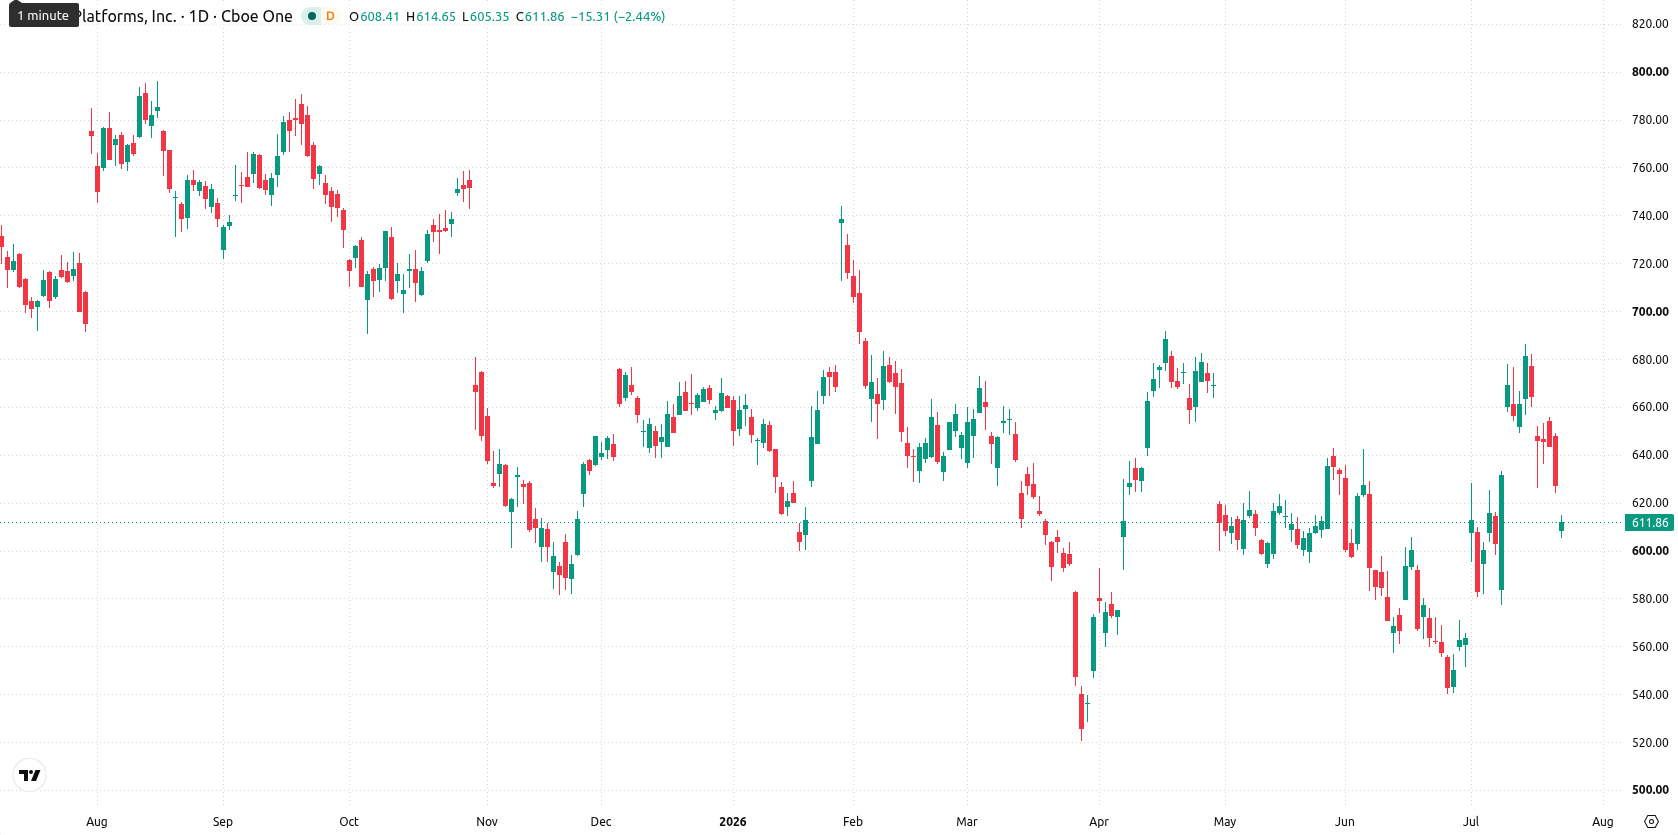
Mixed technical signals as weekly bearish momentum meets longer-term buyer resilience
Weekly technical indicators show mixed signals for META. The weekly MACD points to strong bearish momentum, while the ADX is neutral and does not indicate a clear trend. The weekly RSI is neutral to slightly bullish, with the Stochastic RSI and CCI suggesting mild oversold conditions; however, Bull/Bear Power still favors buyers on the longer-term chart despite ongoing short-term selling pressure. META is trading at the bottom of its weekly range, with implied volatility at 5.09%. Key support lies near $579 and resistance at $639 on the weekly chart.
Neutral bias and breakout risk as META consolidates within weekly range
For the next five trading days, the expected trading range for META is $579 to $639, based on current pricing and typical weekly volatility. With two of four main W1 indicators in buy or strong buy territory, price direction appears balanced and there is a 50/50 probability of a move higher or lower. The likely baseline scenario is for META to consolidate sideways between immediate support and resistance. A breakout above $639 may trigger further upside, while a drop below $579 could accelerate selling toward the longer-term support near the MA-200.
Earlier, analysts noted that Meta’s momentum was mixed, with short-term optimism tempered by medium- and longer-term resistance as the company expanded its AI and cloud initiatives. The current setup reinforces this dynamic, suggesting traders should watch closely for a breakout above $639 or a breakdown below $579 as potential catalysts for renewed directional movement.


Latest META News







-
 Afghanistan
-
 Albania
-
 Algeria
-
 Angola
-
 Argentina
-
 Armenia
-
 Australia
-
 Austria
-
 Azerbaijan
-
 Bahamas
-
 Bahrain
-
 Bangladesh
-
 Belarus
-
 Belgium
-
 Bolivia
-
 Botswana
-
 Brazil
-
 Brunei
-
 Bulgaria
-
 Cambodia
-
 Cameroon
-
 Canada
-
 Chile
Chile
-
 China
China
-
 Colombia
-
 Congo
Congo
-
 Costa Rica
-
 Cote d'Ivoire
-
 Croatia
-
 Cuba
Cuba
-
 Cyprus
-
 Czechia
-
 DR Congo
-
 Denmark
-
 Dominican Republic
-
 Ecuador
-
 Egypt
Egypt
-
 El Salvador
-
 Estonia
-
 Eswatini
-
 Ethiopia
-
 Finland
-
 France
-
 Georgia
-
 Germany
-
 Ghana
Ghana
-
 Greece
-
 Haiti
Haiti
-
 Hong Kong
-
 Hungary
-
 India
India
-
 Indonesia
-
 Iran, Islamic republic
-
 Iraq
Iraq
-
 Ireland
-
 Israel
-
 Italy
Italy
-
 Jamaica
-
 Japan
Japan
-
 Jordan
-
 Kazakhstan
-
 Kenya
Kenya
-
 Korea
Korea
-
 Kuwait
-
 Kyrgyzstan
-
 Laos
Laos
-
 Latvia
-
 Lebanon
-
 Lesotho
-
 Libya
Libya
-
 Lithuania
-
 Luxembourg
-
 Madagascar
-
 Malaysia
-
 Malta
Malta
-
 Mauritius
-
 Mexico
-
 Moldova
-
 Mongolia
-
 Montenegro
-
 Morocco
-
 Mozambique
-
 Myanmar
-
 Namibia
-
 Nepal
Nepal
-
 Netherlands
-
 New Zealand
-
 Nigeria
-
 North Macedonia
-
 Norway
-
 Oman
Oman
-
 Pakistan
-
 Palestine
-
 Panama
-
 Papua New Guinea
-
 Paraguay
-
 Peru
Peru
-
 Philippines
-
 Poland
-
 Portugal
-
 Puerto Rico
-
 Qatar
Qatar
-
 Reunion
-
 Romania
-
 Rwanda
-
 Saudi Arabia
-
 Serbia
-
 Singapore
-
 Slovakia
-
 Slovenia
-
 Somalia
-
 South Africa
-
 Spain
Spain
-
 Sri Lanka
-
 Sweden
-
 Switzerland
-
 Syria
Syria
-
 Taiwan
-
 Tajikistan
-
 Tanzania
-
 Thailand
-
 Trinidad and Tobago
-
 Tunisia
-
 Turkey
-
 UAE
UAE
-
 Uganda
-
 Ukraine
-
 United Kingdom
-
United States
-
 Uruguay
-
 Uzbekistan
-
 Venezuela
-
 Vietnam
-
 Yemen
Yemen
-
 Zambia
-
 Zimbabwe
- Forex
- Crypto












