
Test of $2.48 resistance lifts Bit Digital stock by 3.23%

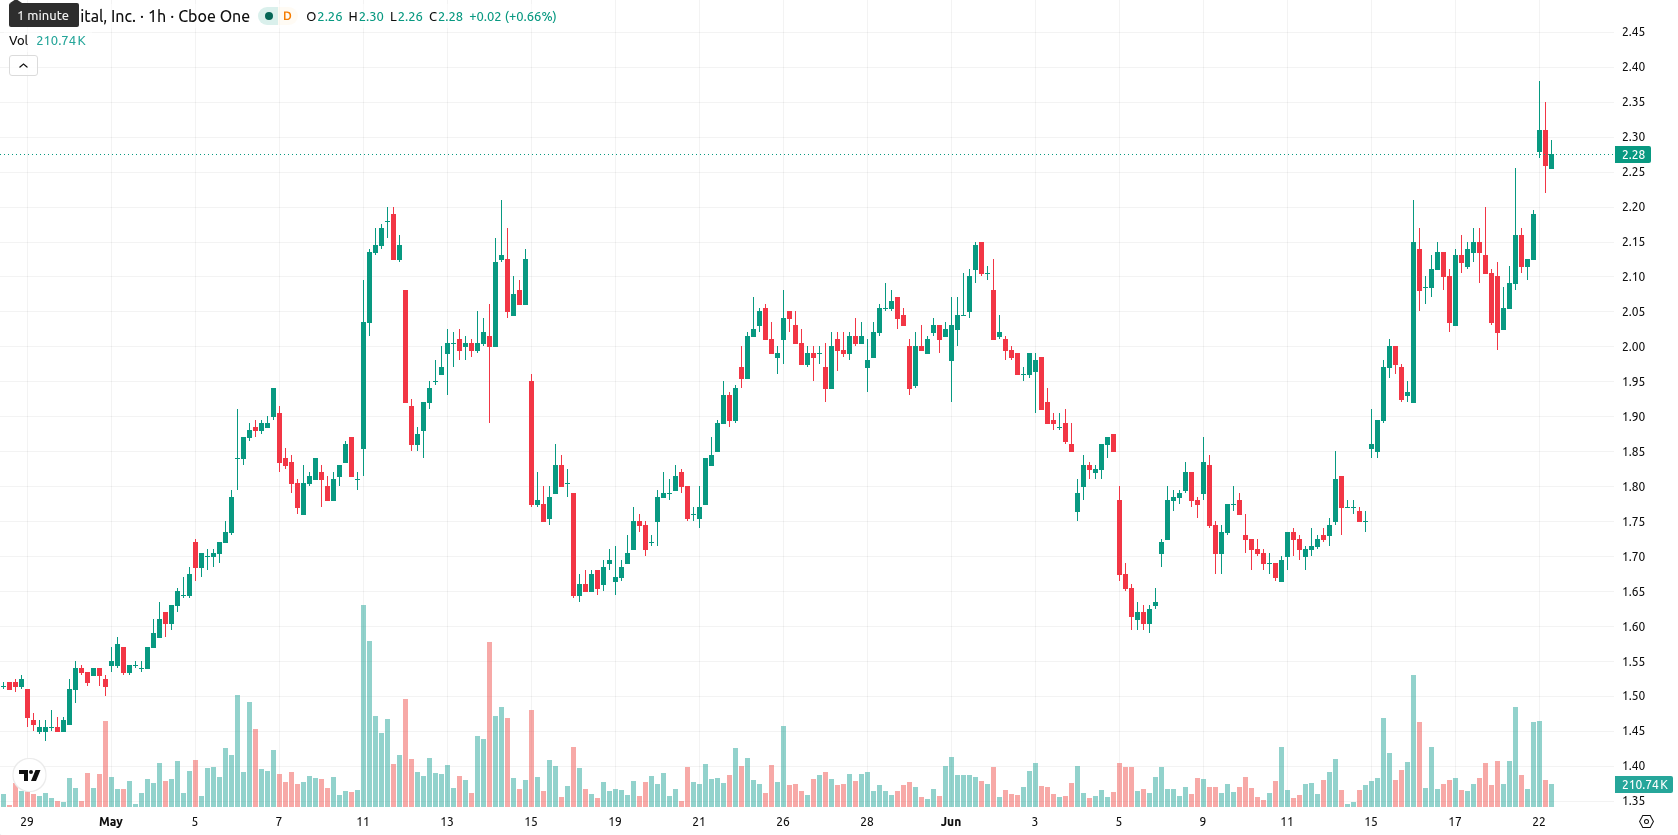
Bit Digital Inc. (BTBT) stock is trading at $2.24 after rising 3.23% over the prior session. The stock is currently positioned above its key short- and medium-term moving averages, while testing long-term resistance.
Highlights
- BTBT/USD maintains a bullish short- and medium-term structure, but faces long-term resistance near the current price zone.
- Momentum signals are strongly positive and main oscillators favor buyers, though several indicators are showing overbought conditions requiring caution for immediate upside.
- Price is expected to consolidate within a $2.08–$2.48 range over the next 2–3 days, with a higher likelihood of an upward move.
Momentum signals diverge as bullish trend faces resistance
BTBT has cleared the MA-20 ($2.13) and MA-50 ($1.94), but is just under the MA-200 ($2.25), which represents a critical long-term resistance. The Ichimoku Kijun sits at $2.16 and acts as immediate support. Additional technical signals include MACD and ADX both registering Buy, while BBP confirms intraday buyer dominance. RSI is in the Buy zone; however, Stoch RSI and CCI appear overbought, suggesting short-term upside may be limited despite overall bullish momentum. The Awesome Oscillator (AO) is aligned with the current trend, reinforcing the signal, although today’s volatile price action—closing near the low—contrasts with the broadly bullish indicator readings.
Range-bound trade likely as volatility defines near-term outlook
In the short term, price action is likely to fluctuate within the $2.08–$2.48 band, consistent with typical volatility at current levels. The baseline scenario calls for consolidation within this range over the next 2–3 trading days, with a high likelihood of attempts to break higher. Should BTBT move above $2.48, a bullish scenario may unfold, while a daily close below the $2.08 support would open the door to a bearish setup.
Earlier, analysts noted that Bit Digital was exhibiting strong short- and medium-term momentum while facing notable long-term resistance amid heightened volatility. The latest technical signals further reinforce this view, with current price action at a major inflection point; a sustained move above long-term resistance would amplify bullish potential, while failure to hold key support could quickly reverse sentiment.


Latest Bit Digital News


-
 Afghanistan
-
 Albania
-
 Algeria
-
 Angola
-
 Argentina
-
 Armenia
-
 Australia
-
 Austria
-
 Azerbaijan
-
 Bahamas
-
 Bahrain
-
 Bangladesh
-
 Belarus
-
 Belgium
-
 Bolivia
-
 Botswana
-
 Brazil
-
 Brunei
-
 Bulgaria
-
 Cambodia
-
 Cameroon
-
 Canada
-
 Chile
Chile
-
 China
China
-
 Colombia
-
 Congo
Congo
-
 Costa Rica
-
 Cote d'Ivoire
-
 Croatia
-
 Cuba
Cuba
-
 Cyprus
-
 Czechia
-
 DR Congo
-
 Denmark
-
 Dominican Republic
-
 Ecuador
-
 Egypt
Egypt
-
 El Salvador
-
 Estonia
-
 Eswatini
-
 Ethiopia
-
 Finland
-
 France
-
 Georgia
-
 Germany
-
 Ghana
Ghana
-
 Greece
-
 Haiti
Haiti
-
 Hong Kong
-
 Hungary
-
 India
India
-
 Indonesia
-
 Iran, Islamic republic
-
 Iraq
Iraq
-
 Ireland
-
 Israel
-
 Italy
Italy
-
 Jamaica
-
 Japan
Japan
-
 Jordan
-
 Kazakhstan
-
 Kenya
Kenya
-
 Korea
Korea
-
 Kuwait
-
 Kyrgyzstan
-
 Laos
Laos
-
 Latvia
-
 Lebanon
-
 Lesotho
-
 Libya
Libya
-
 Lithuania
-
 Luxembourg
-
 Madagascar
-
 Malaysia
-
 Malta
Malta
-
 Mauritius
-
 Mexico
-
 Moldova
-
 Mongolia
-
 Montenegro
-
 Morocco
-
 Mozambique
-
 Myanmar
-
 Namibia
-
 Nepal
Nepal
-
 Netherlands
-
 New Zealand
-
 Nigeria
-
 North Macedonia
-
 Norway
-
 Oman
Oman
-
 Pakistan
-
 Palestine
-
 Panama
-
 Papua New Guinea
-
 Paraguay
-
 Peru
Peru
-
 Philippines
-
 Poland
-
 Portugal
-
 Puerto Rico
-
 Qatar
Qatar
-
 Reunion
-
 Romania
-
 Rwanda
-
 Saudi Arabia
-
 Serbia
-
 Singapore
-
 Slovakia
-
 Slovenia
-
 Somalia
-
 South Africa
-
 Spain
Spain
-
 Sri Lanka
-
 Sweden
-
 Switzerland
-
 Syria
Syria
-
 Taiwan
-
 Tajikistan
-
 Tanzania
-
 Thailand
-
 Trinidad and Tobago
-
 Tunisia
-
 Turkey
-
 UAE
UAE
-
 Uganda
-
 Ukraine
-
 United Kingdom
-
United States
-
 Uruguay
-
 Uzbekistan
-
 Venezuela
-
 Vietnam
-
 Yemen
Yemen
-
 Zambia
-
 Zimbabwe
- Forex
- Crypto
