
Intuit shares show mild rebound with RSI and Stochastic RSI near oversold territory: weekly report

Intuit Inc. (INTU) closed the week at $278.97, climbing $4.05 or 1.51% over the last seven days, but remains well below its weekly MA-20 ($356.54), MA-50 ($515.63), and MA-200 ($550.22). The asset is still trading in the lower part of its recent weekly range, indicating continued downward pressure despite a mild short-term rebound.
 309.60
296.56
309.60
296.56
Highlights
- INTU trades well below key moving averages, signaling sustained bearish pressure and prevailing medium- to long-term downtrend.
- Momentum and oscillators remain decisively negative, with no major weekly indicators suggesting a near-term reversal.
- Price is expected to remain range-bound between $258 and $292, with sellers firmly in control and downside risk elevated.
Litigation, layoffs, and weak TurboTax growth drive negative sentiment this week
Intuit has faced heightened scrutiny after multiple securities class action lawsuits were filed against the company and certain executives, alleging overstatement of its competitive advantages in the TurboTax business and nondisclosure of adverse trends and increased competition. On May 20, 2026, the company announced a significant restructuring plan, reducing its workforce by about 3,000 employees, consolidating operations, and closing offices. Fiscal third quarter 2026 results released the same day showed weaker-than-expected TurboTax revenue growth. Changes in institutional investor positions were also noted during the first quarter.
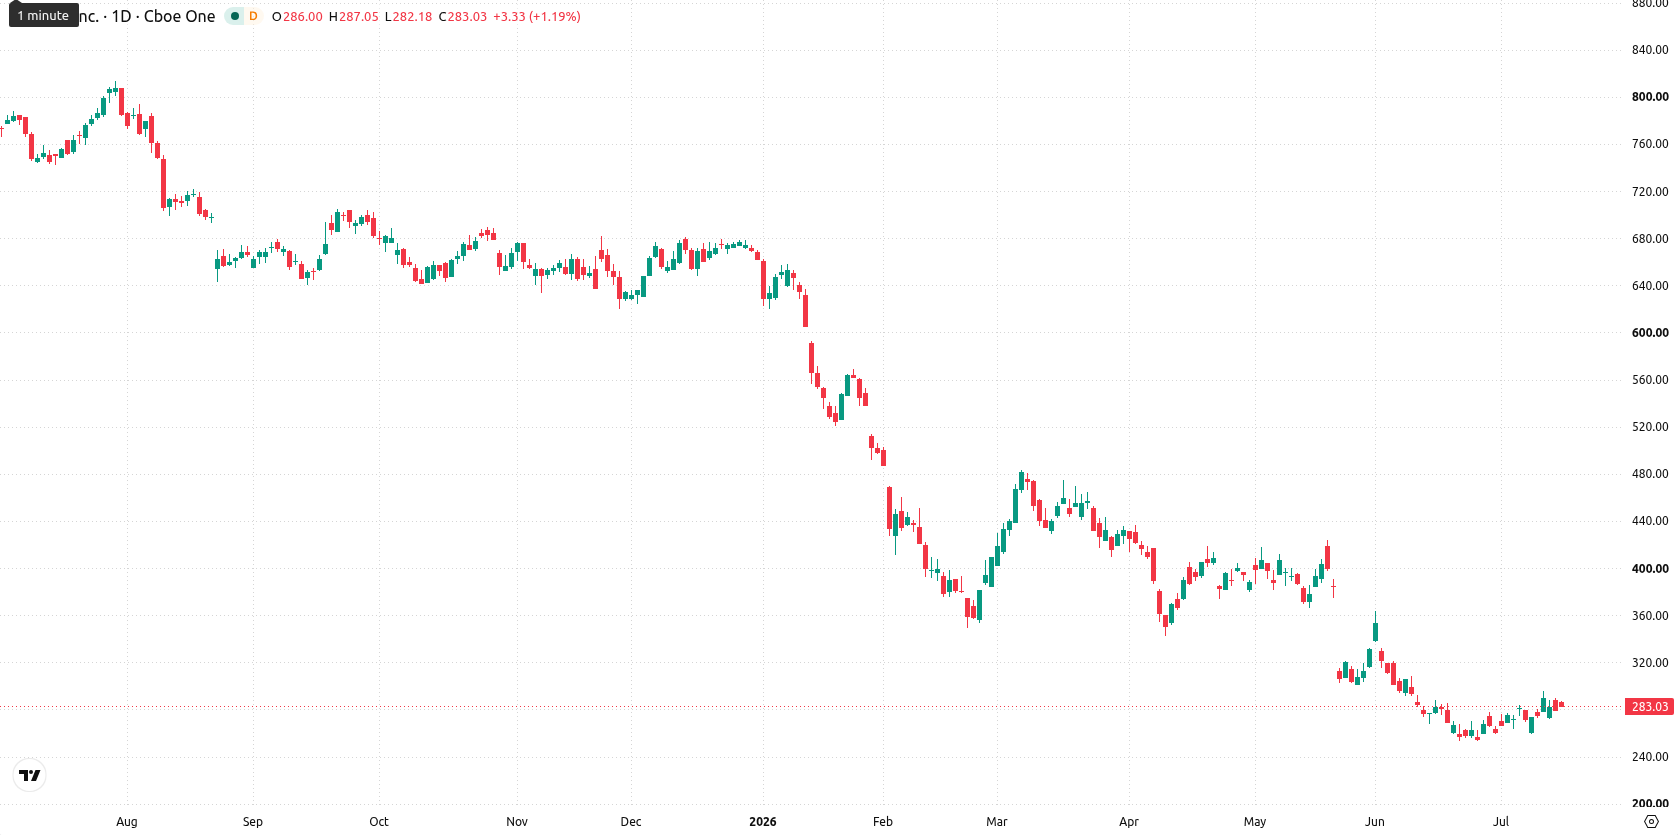
Deepening bearish momentum as technical indicators stay in oversold territory this week
Weekly technical indicators for INTU remain deeply negative. The price holds well beneath the MA-20, MA-50, and MA-200, confirming a bearish trend, with the MA-20 acting as dynamic resistance. Momentum remains weak as MACD signals a strong sell and the ADX shows pronounced downward pressure; the RSI W1, Stochastic RSI, and CCI all hover near oversold territory, while Bull/Bear Power is firmly negative and oversold. Weekly volatility stands at 8.94%, and support and resistance are at $258 and $292 respectively. No indicator currently provides a reversal signal.
Continued downside risk as bearish signals cap upside next week
For the next five trading days, INTU is expected to remain under pressure, likely oscillating between weekly support at $258 and resistance at $292. Given that all major W1 technical signals remain bearish, there is less than a 20% probability of an upside breakout. The baseline scenario is a continued consolidation in the lower range, with a possible retest of support. A clear break below $258 would indicate a renewed downtrend toward fresh lows, while a move above $292 could open the path for a short-term recovery if selling subsides.
Previously it was reported that legal pressures and emerging governance concerns had intensified scrutiny on Intuit while technical signals pointed to mixed momentum with overbought warnings. The current technical landscape confirms a firmly bearish scenario, making the defense of the $258 weekly support a critical focus for traders as downside risks continue to mount.


Latest Intuit News






-
 Afghanistan
-
 Albania
-
 Algeria
-
 Angola
-
 Argentina
-
 Armenia
-
 Australia
-
 Austria
-
 Azerbaijan
-
 Bahamas
-
 Bahrain
-
 Bangladesh
-
 Belarus
-
 Belgium
-
 Bolivia
-
 Botswana
-
 Brazil
-
 Brunei
-
 Bulgaria
-
 Cambodia
-
 Cameroon
-
 Canada
-
 Chile
Chile
-
 China
China
-
 Colombia
-
 Congo
Congo
-
 Costa Rica
-
 Cote d'Ivoire
-
 Croatia
-
 Cuba
Cuba
-
 Cyprus
-
 Czechia
-
 DR Congo
-
 Denmark
-
 Dominican Republic
-
 Ecuador
-
 Egypt
Egypt
-
 El Salvador
-
 Estonia
-
 Eswatini
-
 Ethiopia
-
 Finland
-
 France
-
 Georgia
-
 Germany
-
 Ghana
Ghana
-
 Greece
-
 Haiti
Haiti
-
 Hong Kong
-
 Hungary
-
 India
India
-
 Indonesia
-
 Iran, Islamic republic
-
 Iraq
Iraq
-
 Ireland
-
 Israel
-
 Italy
Italy
-
 Jamaica
-
 Japan
Japan
-
 Jordan
-
 Kazakhstan
-
 Kenya
Kenya
-
 Korea
Korea
-
 Kuwait
-
 Kyrgyzstan
-
 Laos
Laos
-
 Latvia
-
 Lebanon
-
 Lesotho
-
 Libya
Libya
-
 Lithuania
-
 Luxembourg
-
 Madagascar
-
 Malaysia
-
 Malta
Malta
-
 Mauritius
-
 Mexico
-
 Moldova
-
 Mongolia
-
 Montenegro
-
 Morocco
-
 Mozambique
-
 Myanmar
-
 Namibia
-
 Nepal
Nepal
-
 Netherlands
-
 New Zealand
-
 Nigeria
-
 North Macedonia
-
 Norway
-
 Oman
Oman
-
 Pakistan
-
 Palestine
-
 Panama
-
 Papua New Guinea
-
 Paraguay
-
 Peru
Peru
-
 Philippines
-
 Poland
-
 Portugal
-
 Puerto Rico
-
 Qatar
Qatar
-
 Reunion
-
 Romania
-
 Rwanda
-
 Saudi Arabia
-
 Serbia
-
 Singapore
-
 Slovakia
-
 Slovenia
-
 Somalia
-
 South Africa
-
 Spain
Spain
-
 Sri Lanka
-
 Sweden
-
 Switzerland
-
 Syria
Syria
-
 Taiwan
-
 Tajikistan
-
 Tanzania
-
 Thailand
-
 Trinidad and Tobago
-
 Tunisia
-
 Turkey
-
 UAE
UAE
-
 Uganda
-
 Ukraine
-
 United Kingdom
-
United States
-
 Uruguay
-
 Uzbekistan
-
 Venezuela
-
 Vietnam
-
 Yemen
Yemen
-
 Zambia
-
 Zimbabwe
- Forex
- Crypto












