

TMUS slides as management signals weaker upcoming subscriber growth

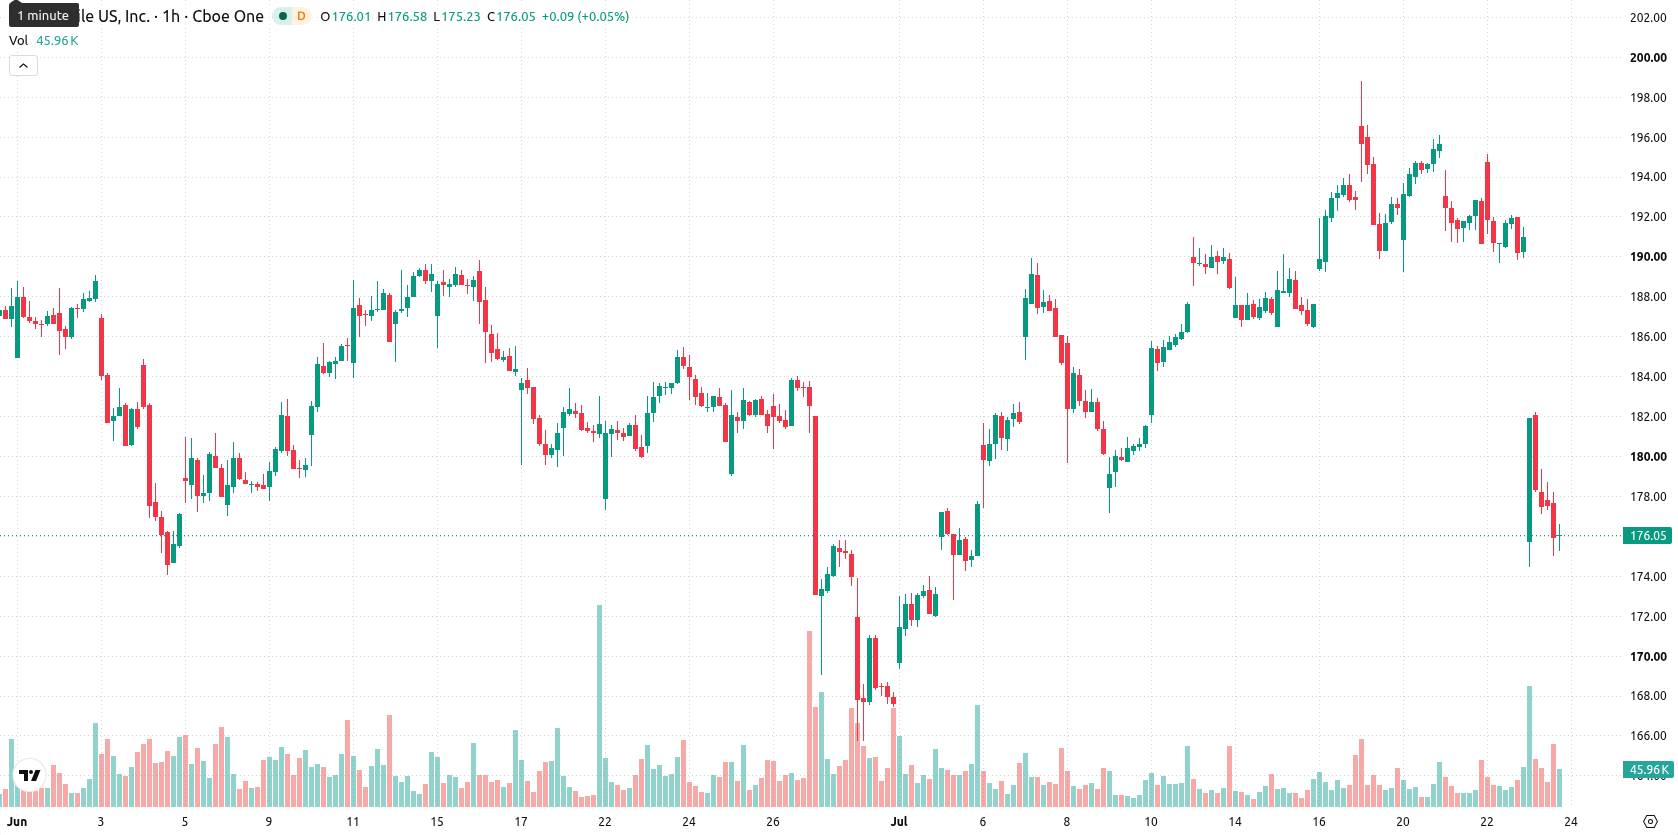
T-Mobile US, Inc. (TMUS) stock is trading at $175.66, down 8% on the day. The price sits below its key moving averages.
 153.81
171.76
153.81
171.76
Highlights
- T-Mobile US exceeded Q2 2026 expectations with EPS of $2.99 and service revenue up 9% to $19.0 billion.
- Management flagged slower subscriber growth for the next quarter, tempering positive sentiment from strong earnings and elevated shareholder returns.
- TMUS trades below key moving averages with high volatility, bearish momentum, and an anticipated range of $162.47 to $179.02 over the next 2–3 days.
Earnings beat and shareholder returns countered by weak subscriber outlook
T-Mobile US delivered second-quarter 2026 earnings per share of $2.99, surpassing the Wall Street consensus of $2.59, while total service revenue grew 9% year-over-year to $19.0 billion and postpaid service revenue was up 13% to $15.9 billion, according to Techtimes. The company returned $3.3 billion to shareholders through $2.2 billion in share repurchases and $1.1 billion in dividends, as noted by Techtimes, alongside a record Net Promoter Score of 46 reflecting higher customer satisfaction. Despite these results, management signaled weaker subscriber growth for the third quarter on the latest earnings call, which contributed to cautious market sentiment.
Oversold technicals and firm resistance underscore persistent downside momentum
On the technical front, TMUS is currently below the MA-20 ($187.38), MA-50 ($189.9), and sits well beneath the MA-200 ($200.83). Ichimoku Kijun resistance is at $185.57. The price is testing support near the session low, with a gap of 10.59 from the prior close. Momentum indicators remain negative: both MACD and ADX show a sell bias, while RSI at 20.37, Stochastic RSI, CCI, and Bull/Bear Power all highlight oversold conditions and sustained seller dominance intraday. The Awesome Oscillator also reinforces this setup, and no divergence is evident across momentum or oscillator readings, confirming the prevailing weakness.
Range-bound action expected amid high downside probability and resistance test
Over the next 2–3 sessions, the anticipated price range is $162.47 to $179.02, representing a typical volatility band relative to current levels. The probability of a further downside move is high at 78%, while only a 22% chance is assigned to a rebound. The baseline scenario calls for consolidation within this range. A bullish move would require a decisive breakout above resistance at $185.57, while a breakdown below $162.47 would likely see accelerated declines.
Earlier, analysts noted that T-Mobile’s structural improvements and strong technical positioning were supporting a bullish medium-term outlook. However, with the stock now exhibiting persistent downside momentum despite robust earnings, traders should closely monitor the $162.47 support level, as a sustained breakdown could signal an escalation in near-term risks.





Latest T-Mobile News




-
 Afghanistan
-
 Albania
-
 Algeria
-
 Angola
-
 Argentina
-
 Armenia
-
 Australia
-
 Austria
-
 Azerbaijan
-
 Bahamas
-
 Bahrain
-
 Bangladesh
-
 Belarus
-
 Belgium
-
 Bolivia
-
 Botswana
-
 Brazil
-
 Brunei
-
 Bulgaria
-
 Cambodia
-
 Cameroon
-
 Canada
-
 Chile
Chile
-
 China
China
-
 Colombia
-
 Congo
Congo
-
 Costa Rica
-
 Cote d'Ivoire
-
 Croatia
-
 Cuba
Cuba
-
 Cyprus
-
 Czechia
-
 DR Congo
-
 Denmark
-
 Dominican Republic
-
 Ecuador
-
 Egypt
Egypt
-
 El Salvador
-
 Estonia
-
 Eswatini
-
 Ethiopia
-
 Finland
-
 France
-
 Georgia
-
 Germany
-
 Ghana
Ghana
-
 Greece
-
 Haiti
Haiti
-
 Hong Kong
-
 Hungary
-
 India
India
-
 Indonesia
-
 Iran, Islamic republic
-
 Iraq
Iraq
-
 Ireland
-
 Israel
-
 Italy
Italy
-
 Jamaica
-
 Japan
Japan
-
 Jordan
-
 Kazakhstan
-
 Kenya
Kenya
-
 Korea
Korea
-
 Kuwait
-
 Kyrgyzstan
-
 Laos
Laos
-
 Latvia
-
 Lebanon
-
 Lesotho
-
 Libya
Libya
-
 Lithuania
-
 Luxembourg
-
 Madagascar
-
 Malaysia
-
 Malta
Malta
-
 Mauritius
-
 Mexico
-
 Moldova
-
 Mongolia
-
 Montenegro
-
 Morocco
-
 Mozambique
-
 Myanmar
-
 Namibia
-
 Nepal
Nepal
-
 Netherlands
-
 New Zealand
-
 Nigeria
-
 North Macedonia
-
 Norway
-
 Oman
Oman
-
 Pakistan
-
 Palestine
-
 Panama
-
 Papua New Guinea
-
 Paraguay
-
 Peru
Peru
-
 Philippines
-
 Poland
-
 Portugal
-
 Puerto Rico
-
 Qatar
Qatar
-
 Reunion
-
 Romania
-
 Rwanda
-
 Saudi Arabia
-
 Serbia
-
 Singapore
-
 Slovakia
-
 Slovenia
-
 Somalia
-
 South Africa
-
 Spain
Spain
-
 Sri Lanka
-
 Sweden
-
 Switzerland
-
 Syria
Syria
-
 Taiwan
-
 Tajikistan
-
 Tanzania
-
 Thailand
-
 Trinidad and Tobago
-
 Tunisia
-
 Turkey
-
 UAE
UAE
-
 Uganda
-
 Ukraine
-
 United Kingdom
-
United States
-
 Uruguay
-
 Uzbekistan
-
 Venezuela
-
 Vietnam
-
 Yemen
Yemen
-
 Zambia
-
 Zimbabwe
- Forex
- Crypto












