

Newmont stock jumps around 6.5% as joint venture and dividend news boost sentiment

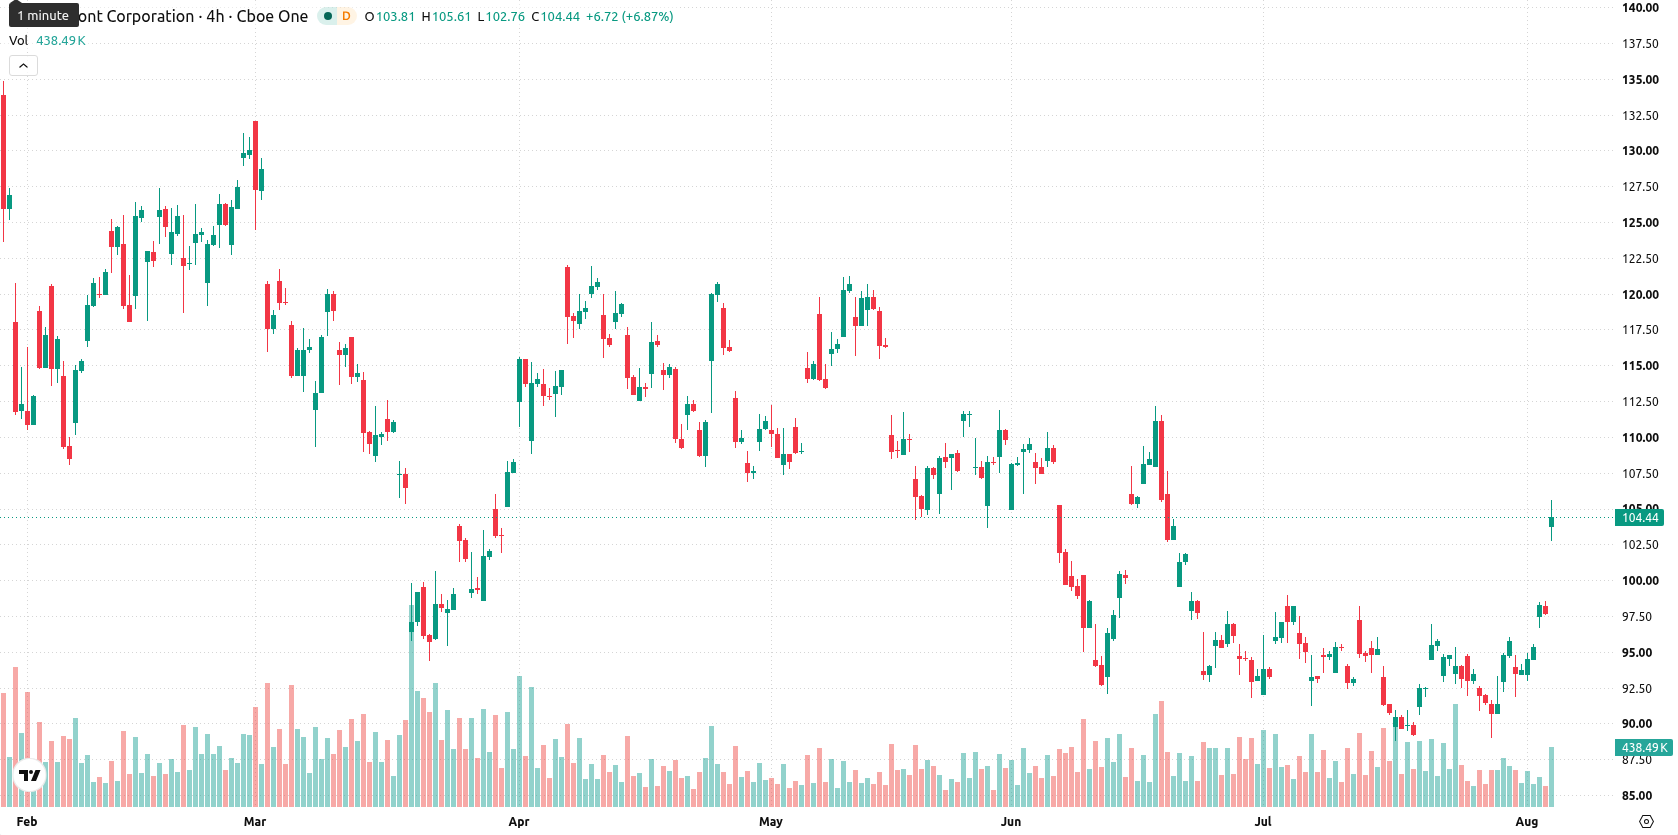
Newmont Corporation (NEM) jumped 6.55% following news of a new joint venture with Headwater Gold for expansion at the Spring Peak Project, as investors responded positively to fresh exploration commitments and an upcoming quarterly dividend. The rally is supported by Newmont's climb above its 20- and 50-day moving averages but remains constrained by lingering long-term caution, with the price just below the 200-day average.
 117.85
119.00
117.85
119.00
Highlights
- Newmont entered a joint venture with Headwater Gold for the Spring Peak Project, securing a 51% stake with an option to reach 65% by funding $40 million in exploration over three years.
- The company declared a quarterly dividend of $0.26 per share, payable September 28, 2024, yielding approximately 1.1% annually.
- Newmont stock is showing near-term bullish momentum but overbought technicals, with an expected trading range of $100.83 to $112.26 over the coming week.
Spring Peak deal and dividend drive repositioning amid stake reduction
Newmont recently announced a definitive joint venture agreement with Headwater Gold for the Spring Peak Project in Nevada, giving it a 51% ownership stake with the potential to increase to 65% by funding an additional $40 million in exploration over three years. The company also declared a quarterly dividend of $0.26 per share, payable September 28, 2024, with an annualized yield of approximately 1.1%. During the first quarter, Rathbones Group PLC reduced its stake in Newmont by 27.5%.
Short-term bullish signals as long-term caution and overbought risks rise
Newmont is trading above its 20-day ($93.56) and 50-day ($98.35) moving averages, but just below its 200-day ($104.28) average, suggesting short- and medium-term bullish pressure alongside lingering long-term caution. The nearest resistance stands at $104.28 with support at $102.82, while the Ichimoku Kijun at $93.96 confirms underlying trend support. On the momentum front, the MACD signals strong selling, and the Average Directional Index (ADX) is neutral, showing unclear trend strength. The Relative Strength Index (RSI) at 54.68 leans slightly bullish, but the Stochastic RSI at 100, CCI at 176.65, and Bull/Bear Power at 4.18 all point to overbought intraday conditions, with buyers dominating short-term momentum. The Awesome Oscillator is neutral. The gain is pronounced, with strong early buying and some balance mid-session; momentum indicators are conflicted, with signals of short-term overstretch even as broader momentum grows.
Earlier, analysts noted that gold mining stocks including Newmont, were leading sector gains as gold futures reached multi-week highs. The current technical setup introduces a new risk of short-term price pullback due to overbought signals, making the $102.82 support level a critical area to watch for potential downside resolution.





Latest Newmont Corporation News






-
 Afghanistan
-
 Albania
-
 Algeria
-
 Angola
-
 Argentina
-
 Armenia
-
 Australia
-
 Austria
-
 Azerbaijan
-
 Bahamas
-
 Bahrain
-
 Bangladesh
-
 Belarus
-
 Belgium
-
 Bolivia
-
 Botswana
-
 Brazil
-
 Brunei
-
 Bulgaria
-
 Cambodia
-
 Cameroon
-
 Canada
-
 Chile
Chile
-
 China
China
-
 Colombia
-
 Congo
Congo
-
 Costa Rica
-
 Cote d'Ivoire
-
 Croatia
-
 Cuba
Cuba
-
 Cyprus
-
 Czechia
-
 DR Congo
-
 Denmark
-
 Dominican Republic
-
 Ecuador
-
 Egypt
Egypt
-
 El Salvador
-
 Estonia
-
 Eswatini
-
 Ethiopia
-
 Finland
-
 France
-
 Georgia
-
 Germany
-
 Ghana
Ghana
-
 Greece
-
 Haiti
Haiti
-
 Hong Kong
-
 Hungary
-
 India
India
-
 Indonesia
-
 Iran, Islamic republic
-
 Iraq
Iraq
-
 Ireland
-
 Israel
-
 Italy
Italy
-
 Jamaica
-
 Japan
Japan
-
 Jordan
-
 Kazakhstan
-
 Kenya
Kenya
-
 Korea
Korea
-
 Kuwait
-
 Kyrgyzstan
-
 Laos
Laos
-
 Latvia
-
 Lebanon
-
 Lesotho
-
 Libya
Libya
-
 Lithuania
-
 Luxembourg
-
 Madagascar
-
 Malaysia
-
 Malta
Malta
-
 Mauritius
-
 Mexico
-
 Moldova
-
 Mongolia
-
 Montenegro
-
 Morocco
-
 Mozambique
-
 Myanmar
-
 Namibia
-
 Nepal
Nepal
-
 Netherlands
-
 New Zealand
-
 Nigeria
-
 North Macedonia
-
 Norway
-
 Oman
Oman
-
 Pakistan
-
 Palestine
-
 Panama
-
 Papua New Guinea
-
 Paraguay
-
 Peru
Peru
-
 Philippines
-
 Poland
-
 Portugal
-
 Puerto Rico
-
 Qatar
Qatar
-
 Reunion
-
 Romania
-
 Rwanda
-
 Saudi Arabia
-
 Serbia
-
 Singapore
-
 Slovakia
-
 Slovenia
-
 Somalia
-
 South Africa
-
 Spain
Spain
-
 Sri Lanka
-
 Sweden
-
 Switzerland
-
 Syria
Syria
-
 Taiwan
-
 Tajikistan
-
 Tanzania
-
 Thailand
-
 Trinidad and Tobago
-
 Tunisia
-
 Turkey
-
 UAE
UAE
-
 Uganda
-
 Ukraine
-
 United Kingdom
-
United States
-
 Uruguay
-
 Uzbekistan
-
 Venezuela
-
 Vietnam
-
 Yemen
Yemen
-
 Zambia
-
 Zimbabwe
- Forex
- Crypto












