

BSX climbs around 3.5% after Q2 earnings beat and revenue surprise

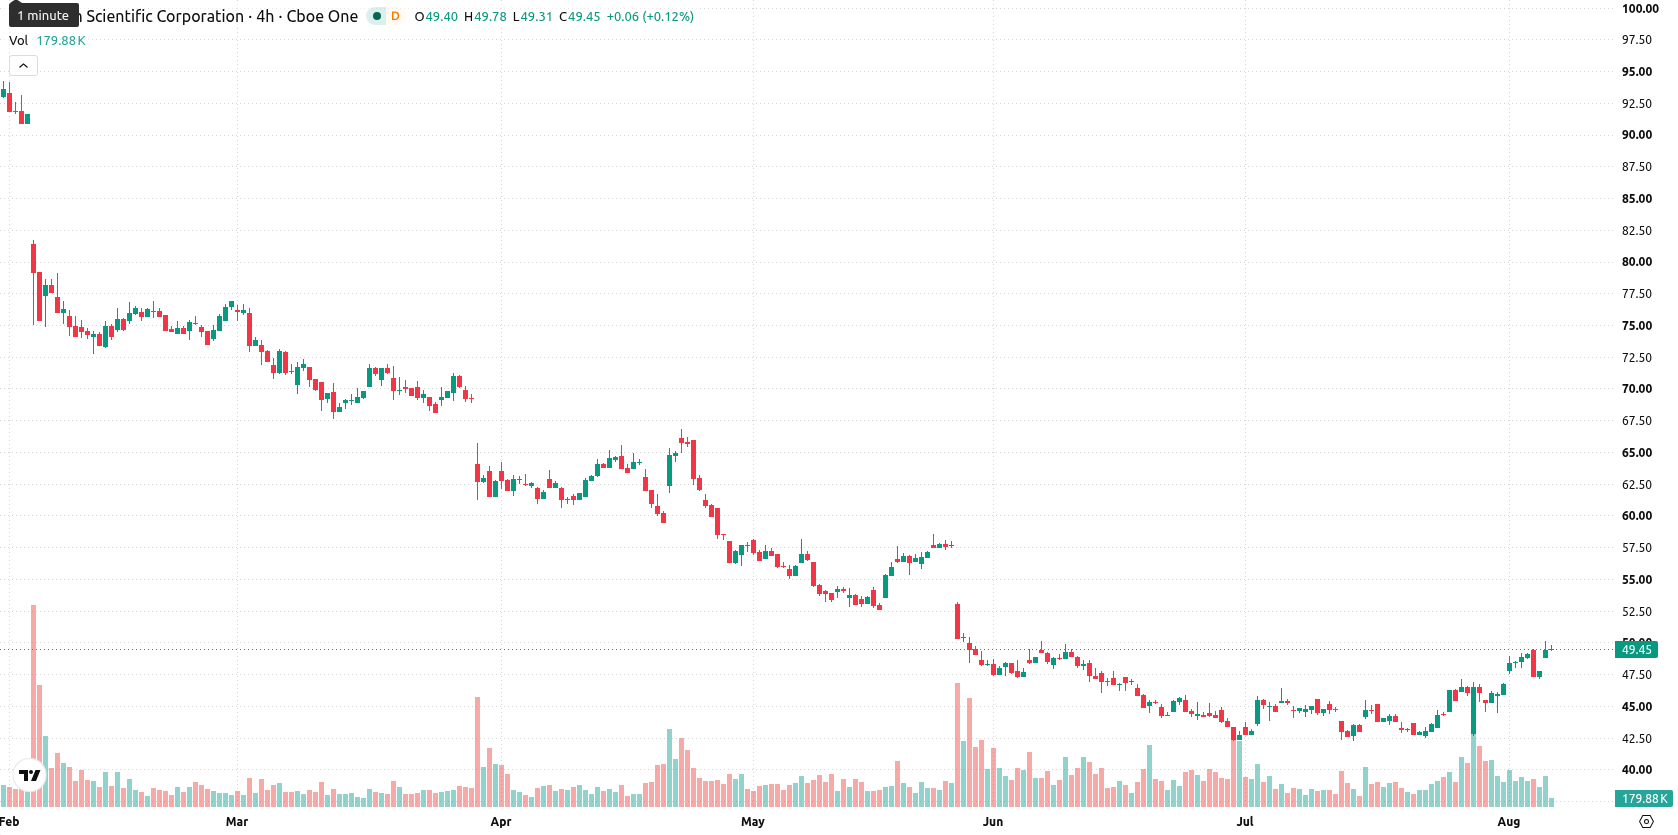
Boston Scientific Corporation (BSX) surged 3.51% after its second-quarter results exceeded revenue and earnings expectations, fueling buying interest. The magnitude of the move looks limited, with shares staying above the 20- and 50-day moving averages but well below the 200-day, highlighting a longer-term bearish trend.
 44.36
45.34
Highlights
- Boston Scientific reported second-quarter revenue of $5.44 billion, rising 7.5% year over year and exceeding forecasts.
- Management lowered forward guidance despite an earnings per share surprise and announced $500 million in annual savings with seven new product launches targeted by 2028.
- Shares gained 3.51% intraday, but technicals signal overbought conditions and project a short-term range of $46.9 to $51.94.
Guidance cut and investor exit temper strong earnings surprise
Boston Scientific reported second-quarter revenue of $5.44 billion, a 7.5% increase over the prior year and above analyst estimates. The company posted an earnings per share surprise of 3.61% above consensus. Management lowered future guidance, and Sapient Capital LLC revealed a significant reduction in its position, with plans for $500 million in annual savings and seven anticipated product launches by 2028 also announced.
Mixed momentum as near-term bullishness clashes with stretched indicators
BSX trades above its 20-day ($45.1) and 50-day ($46.09) moving averages, which indicates bullish short- and medium-term momentum. However, it is still well below the 200-day ($72.44) moving average, pointing to a bearish longer-term trend. Immediate resistance is located at $49.49, while support stands at $49.03. The Ichimoku Kijun at $45.71 provides a more distant trend reference. Momentum signals are mixed: the MACD and RSI (currently 58.99, in the "Buy" zone) favor buyers, supported by a positive Awesome Oscillator and strong intraday Bull/Bear Power (BBP at 2.6). Contrasting this, the ADX, Stochastic RSI, CCI, and BBP flag overbought conditions and waning conviction. Intraday price action is mid-range, with volatility amplitude at 2.26%.
Earlier, analysts noted that Boston Scientific was experiencing persistent technical weakness, with price action and indicators signaling a sideways or hesitant trend. The latest earnings surprise, management updates, and continued mixed momentum add complexity to the picture, making the $49.49 resistance level pivotal for confirming a bullish breakout scenario going forward.






Latest Boston Scientific News




-
 Afghanistan
-
 Albania
-
 Algeria
-
 Angola
-
 Argentina
-
 Armenia
-
 Australia
-
 Austria
-
 Azerbaijan
-
 Bahamas
-
 Bahrain
-
 Bangladesh
-
 Belarus
-
 Belgium
-
 Bolivia
-
 Botswana
-
 Brazil
-
 Brunei
-
 Bulgaria
-
 Cambodia
-
 Cameroon
-
 Canada
-
 Chile
-
 China
-
 Colombia
-
 Congo
-
 Costa Rica
-
 Cote d'Ivoire
-
 Croatia
-
 Cuba
-
 Cyprus
-
 Czechia
-
 DR Congo
-
 Denmark
-
 Dominican Republic
-
 Ecuador
-
 Egypt
-
 El Salvador
-
 Estonia
-
 Eswatini
-
 Ethiopia
-
 Finland
-
 France
-
 Georgia
-
 Germany
-
 Ghana
-
 Greece
-
 Haiti
-
 Hong Kong
-
 Hungary
-
 India
-
 Indonesia
-
 Iran, Islamic republic
-
 Iraq
-
 Ireland
-
 Israel
-
 Italy
-
 Jamaica
-
 Japan
-
 Jordan
-
 Kazakhstan
-
 Kenya
-
 Korea
-
 Kuwait
-
 Kyrgyzstan
-
 Laos
-
 Latvia
-
 Lebanon
-
 Lesotho
-
 Libya
-
 Lithuania
-
 Luxembourg
-
 Madagascar
-
 Malaysia
-
 Malta
-
 Mauritius
-
 Mexico
-
 Moldova
-
 Mongolia
-
 Montenegro
-
 Morocco
-
 Mozambique
-
 Myanmar
-
 Namibia
-
 Nepal
-
 Netherlands
-
 New Zealand
-
 Nigeria
-
 North Macedonia
-
 Norway
-
 Oman
-
 Pakistan
-
 Palestine
-
 Panama
-
 Papua New Guinea
-
 Paraguay
-
 Peru
-
 Philippines
-
 Poland
-
 Portugal
-
 Puerto Rico
-
 Qatar
-
 Reunion
-
 Romania
-
 Rwanda
-
 Saudi Arabia
-
 Serbia
-
 Singapore
-
 Slovakia
-
 Slovenia
-
 Somalia
-
 South Africa
-
 Spain
-
 Sri Lanka
-
 Sweden
-
 Switzerland
-
 Syria
-
 Taiwan
-
 Tajikistan
-
 Tanzania
-
 Thailand
-
 Trinidad and Tobago
-
 Tunisia
-
 Turkey
-
 UAE
-
 Uganda
-
 Ukraine
-
 United Kingdom
-
United States
-
 Uruguay
-
 Uzbekistan
-
 Venezuela
-
 Vietnam
-
 Yemen
-
 Zambia
-
 Zimbabwe
- Forex
- Crypto












