

Walmart shares rally runs into overbought conditions: weekly analysis

Shares of Walmart Inc. (WMT) are trading near $115 as a multi-week rally shows signs of stalling, with conflicting technical signals and compressed price action dominating the chart. The market remains divided between overbought momentum and neutral breadth, keeping direction unclear as the week begins.
 119.28
121.22
Highlights
- Shares of Walmart closed at $115.37, gaining $0.1 over the last 7 days during a period of narrow-range consolidation.
- Technical momentum indicators are mixed, with bullish short-term structure but a bearish signal on the long-term trend.
- Support is at $114.42 with resistance at $116.33, and expected trading range for the week is $109.62 to $117.18.
Earnings anticipation and retail initiatives drive weekly sentiment
Walmart is set to report its second quarter earnings on August 20, 2026, with management holding a live conference call shortly after, according to Yahoo Finance. Expectations are focused on continued strength in e-commerce and advertising, alongside attention to cost pressures in the retail sector. Recent developments include new exclusive product launches, a pilot of Symbotic's in-store automation system, and the company's continued streak of annual dividend increases, as highlighted by The Motley Fool and Simply Wall St News.
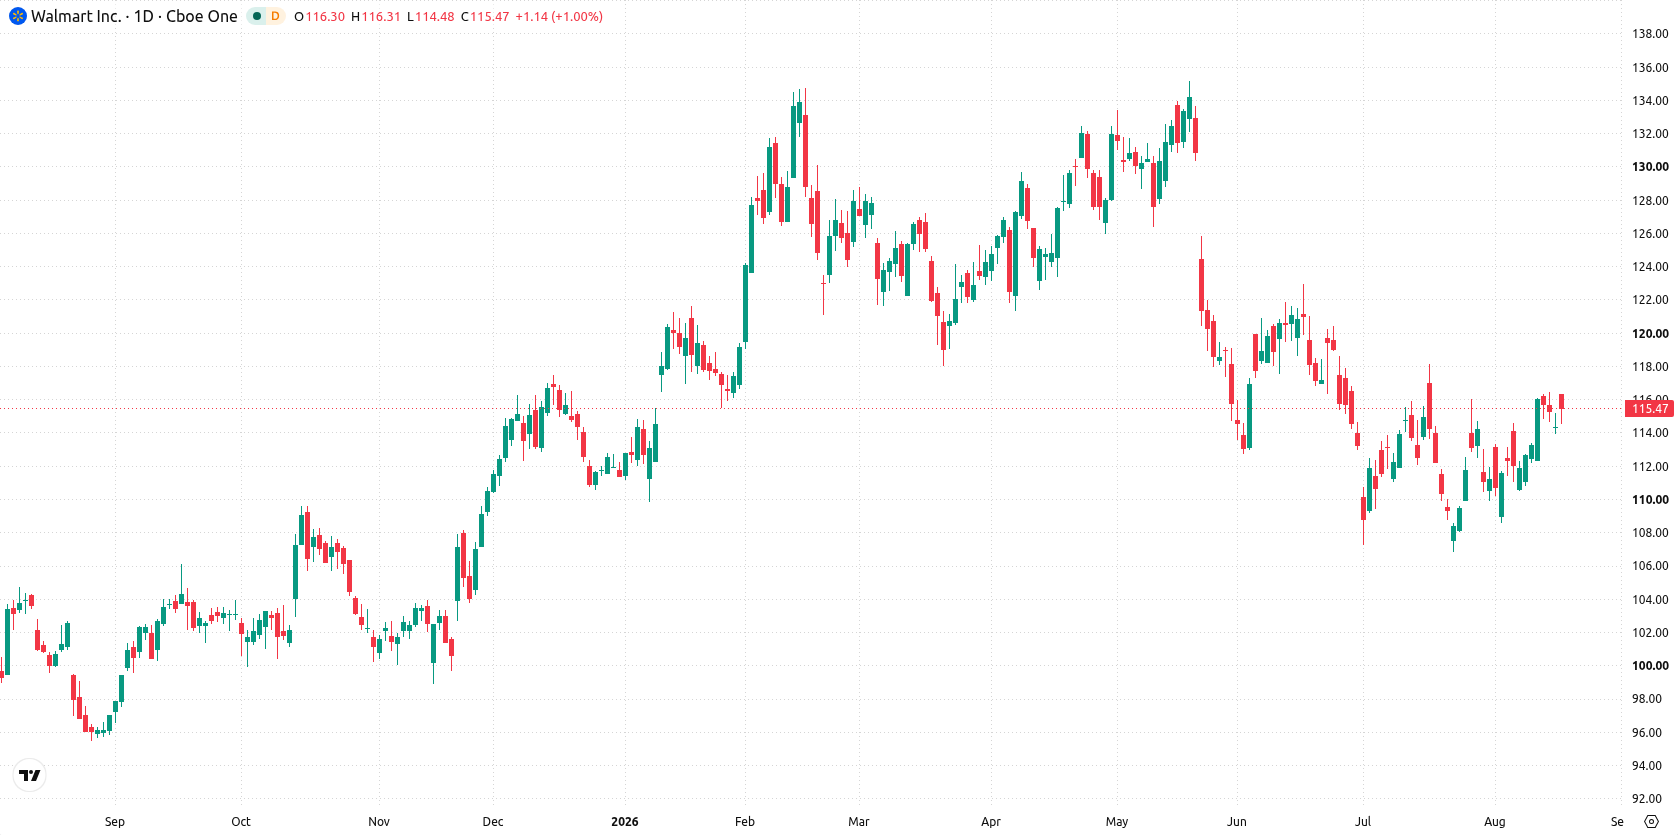
Narrow weekly range as mixed momentum tempers volatility
The daily chart structure shows consolidation, with Walmart displaying a contained move within a narrow range and a 7-day volatility of 3.61%. Momentum signals are mixed: Bull/Bear Power is in an overbought state, while RSI at 53.03 remains neutral. Immediate support stands at $114.42, with resistance at $116.33, while the Ichimoku Kijun acts as additional support at $112.44.
Consolidation bias with breakout risk in coming week
For the coming trading week, the expected range is $109.62 to $117.18. The probability of a decrease is 61%, with 39% odds of an increase. The base case favors continued consolidation between $114.42 support and $116.33 resistance. Should shares break above $116.33, there is potential for upside toward the upper end of the projected range. A drop below $114.42 would open room for further downside toward $112.44 and possibly $109.62.
Earlier, analysts noted that rising profitability in Walmart's advertising unit was helping offset softer same-store sales growth and increased cost pressures in the retail business. With the stock now consolidating and technical indicators mixed ahead of the upcoming earnings report, traders should closely monitor a potential breakout above resistance at $116.33 or a move below $114.42 to gauge near-term directional risk.










-
 Afghanistan
-
 Albania
-
 Algeria
-
 Angola
-
 Argentina
-
 Armenia
-
 Australia
-
 Austria
-
 Azerbaijan
-
 Bahamas
-
 Bahrain
-
 Bangladesh
-
 Belarus
-
 Belgium
-
 Bolivia
-
 Botswana
-
 Brazil
-
 Brunei
-
 Bulgaria
-
 Cambodia
-
 Cameroon
-
 Canada
-
 Chile
-
 China
-
 Colombia
-
 Congo
-
 Costa Rica
-
 Cote d'Ivoire
-
 Croatia
-
 Cuba
-
 Cyprus
-
 Czechia
-
 DR Congo
-
 Denmark
-
 Dominican Republic
-
 Ecuador
-
 Egypt
-
 El Salvador
-
 Estonia
-
 Eswatini
-
 Ethiopia
-
 Finland
-
 France
-
 Georgia
-
 Germany
-
 Ghana
-
 Greece
-
 Haiti
-
 Hong Kong
-
 Hungary
-
 India
-
 Indonesia
-
 Iran, Islamic republic
-
 Iraq
-
 Ireland
-
 Israel
-
 Italy
-
 Jamaica
-
 Japan
-
 Jordan
-
 Kazakhstan
-
 Kenya
-
 Korea
-
 Kuwait
-
 Kyrgyzstan
-
 Laos
-
 Latvia
-
 Lebanon
-
 Lesotho
-
 Libya
-
 Lithuania
-
 Luxembourg
-
 Madagascar
-
 Malaysia
-
 Malta
-
 Mauritius
-
 Mexico
-
 Moldova
-
 Mongolia
-
 Montenegro
-
 Morocco
-
 Mozambique
-
 Myanmar
-
 Namibia
-
 Nepal
-
 Netherlands
-
 New Zealand
-
 Nigeria
-
 North Macedonia
-
 Norway
-
 Oman
-
 Pakistan
-
 Palestine
-
 Panama
-
 Papua New Guinea
-
 Paraguay
-
 Peru
-
 Philippines
-
 Poland
-
 Portugal
-
 Puerto Rico
-
 Qatar
-
 Reunion
-
 Romania
-
 Rwanda
-
 Saudi Arabia
-
 Serbia
-
 Singapore
-
 Slovakia
-
 Slovenia
-
 Somalia
-
 South Africa
-
 Spain
-
 Sri Lanka
-
 Sweden
-
 Switzerland
-
 Syria
-
 Taiwan
-
 Tajikistan
-
 Tanzania
-
 Thailand
-
 Trinidad and Tobago
-
 Tunisia
-
 Turkey
-
 UAE
-
 Uganda
-
 Ukraine
-
 United Kingdom
-
United States
-
 Uruguay
-
 Uzbekistan
-
 Venezuela
-
 Vietnam
-
 Yemen
-
 Zambia
-
 Zimbabwe
- Forex
- Crypto












