


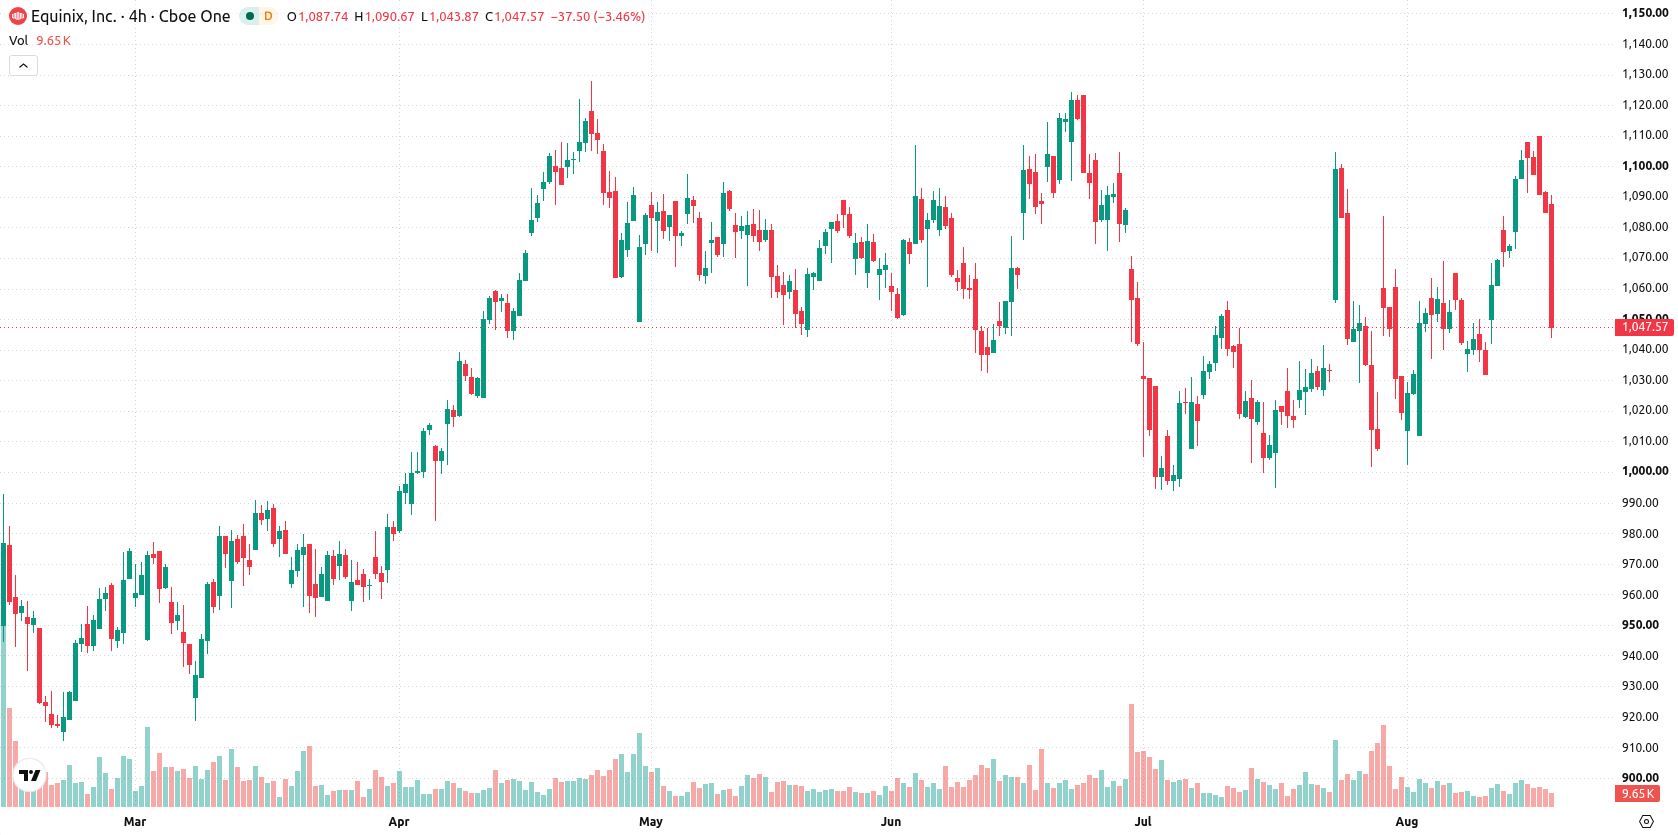
Equinix Inc (EQIX) slid 3.35% amid persistent selling pressure after a higher open, with downside action unfolding even as strong second-quarter results and new institutional inflows headline the news backdrop. The drop is reinforced by EQIX trading below its 20- and 50-day moving averages, which highlights prevailing short- and medium-term weakness despite a longer-term bullish structure.
 1038.44
1044.11
1038.44
1044.11
Highlights
- Equinix posted second-quarter 2026 revenue of $2.625 billion, up 16% year-on-year, with operating income rising 35% to $665 million.
- Major institutions including Mitsubishi UFJ Asset Management and Danica Pension Livsforsikringsaktieselskab opened new positions, and the company secured its fourth renewable energy deal in Singapore since 2024.
- Shares of Equinix closed at $1,048, down 3.35% as the stock trades below short- and medium-term averages with mixed technical indicator signals and an expected 5-day range of $1,002 to $1,070.
New investor entries and green deals as price decouples from fundamentals
Equinix reported second-quarter 2026 revenues of $2.625 billion, a 16% annual increase, with operating income rising 35% to $665 million and net income attributable to common stockholders at $479 million. Major institutional investors, including Mitsubishi UFJ Asset Management and Danica Pension Livsforsikringsaktieselskab, acquired significant new positions during the second quarter, and director Christopher B. Paisley filed for planned share sales as equity compensation. The company also agreed to a fourth renewable energy purchase in Singapore since 2024, partnering with Flo Energy Singapore for at least 11.5 MWp of rooftop solar capacity—though price action has remained under broader selling pressure.
Short-term weakness confirmed as technicals split on momentum
EQIX is trading below its 20-day ($1,052) and 50-day ($1,051) moving averages, reflecting continued short- and medium-term selling, but remains above the 200-day ($945.58) average, preserving a bullish long-term technical bias. The near-term resistance is set at $1,051, with the nearest support marked by today's low of $1,044. Indicators present mixed momentum: the MACD is bullish but the ADX remains neutral. The RSI signals modest bullishness, the Stochastic RSI is in strong sell territory, and both the CCI and Bull/Bear Power suggest overbought conditions. The AO is positive, which favors buyers, but persistent selling dominates intraday action, evidenced by a 4.19% volatility spike and the price hovering near session lows. Overall, technical signals show divergence between short-term momentum and real-time price action.
Earlier, analysts noted that Equinix's constructive long-term technical outlook was tempered by caution over potential near-term downside, citing mixed momentum signals and pivotal support levels. The current analysis adds a new dimension by highlighting heightened volatility alongside strong institutional inflows, with the key risk now centering on whether EQIX can maintain support near $1,044 to avoid a move toward $1,002.





Latest Equinix News




-
 Afghanistan
-
 Albania
-
 Algeria
-
 Angola
-
 Argentina
-
 Armenia
-
 Australia
-
 Austria
-
 Azerbaijan
-
 Bahamas
-
 Bahrain
-
 Bangladesh
-
 Belarus
-
 Belgium
-
 Bolivia
-
 Botswana
-
 Brazil
-
 Brunei
-
 Bulgaria
-
 Cambodia
-
 Cameroon
-
 Canada
-
 Chile
Chile
-
 China
China
-
 Colombia
-
 Congo
Congo
-
 Costa Rica
-
 Cote d'Ivoire
-
 Croatia
-
 Cuba
Cuba
-
 Cyprus
-
 Czechia
-
 DR Congo
-
 Denmark
-
 Dominican Republic
-
 Ecuador
-
 Egypt
Egypt
-
 El Salvador
-
 Estonia
-
 Eswatini
-
 Ethiopia
-
 Finland
-
 France
-
 Georgia
-
 Germany
-
 Ghana
Ghana
-
 Greece
-
 Haiti
Haiti
-
 Hong Kong
-
 Hungary
-
 India
India
-
 Indonesia
-
 Iran, Islamic republic
-
 Iraq
Iraq
-
 Ireland
-
 Israel
-
 Italy
Italy
-
 Jamaica
-
 Japan
Japan
-
 Jordan
-
 Kazakhstan
-
 Kenya
Kenya
-
 Korea
Korea
-
 Kuwait
-
 Kyrgyzstan
-
 Laos
Laos
-
 Latvia
-
 Lebanon
-
 Lesotho
-
 Libya
Libya
-
 Lithuania
-
 Luxembourg
-
 Madagascar
-
 Malaysia
-
 Malta
Malta
-
 Mauritius
-
 Mexico
-
 Moldova
-
 Mongolia
-
 Montenegro
-
 Morocco
-
 Mozambique
-
 Myanmar
-
 Namibia
-
 Nepal
Nepal
-
 Netherlands
-
 New Zealand
-
 Nigeria
-
 North Macedonia
-
 Norway
-
 Oman
Oman
-
 Pakistan
-
 Palestine
-
 Panama
-
 Papua New Guinea
-
 Paraguay
-
 Peru
Peru
-
 Philippines
-
 Poland
-
 Portugal
-
 Puerto Rico
-
 Qatar
Qatar
-
 Reunion
-
 Romania
-
 Rwanda
-
 Saudi Arabia
-
 Serbia
-
 Singapore
-
 Slovakia
-
 Slovenia
-
 Somalia
-
 South Africa
-
 Spain
Spain
-
 Sri Lanka
-
 Sweden
-
 Switzerland
-
 Syria
Syria
-
 Taiwan
-
 Tajikistan
-
 Tanzania
-
 Thailand
-
 Trinidad and Tobago
-
 Tunisia
-
 Turkey
-
 UAE
UAE
-
 Uganda
-
 Ukraine
-
 United Kingdom
-
United States
-
 Uruguay
-
 Uzbekistan
-
 Venezuela
-
 Vietnam
-
 Yemen
Yemen
-
 Zambia
-
 Zimbabwe
- Forex
- Crypto












