

Hewlett Packard Enterprise shares fall around 3.5% as stock slides despite bullish technical signals

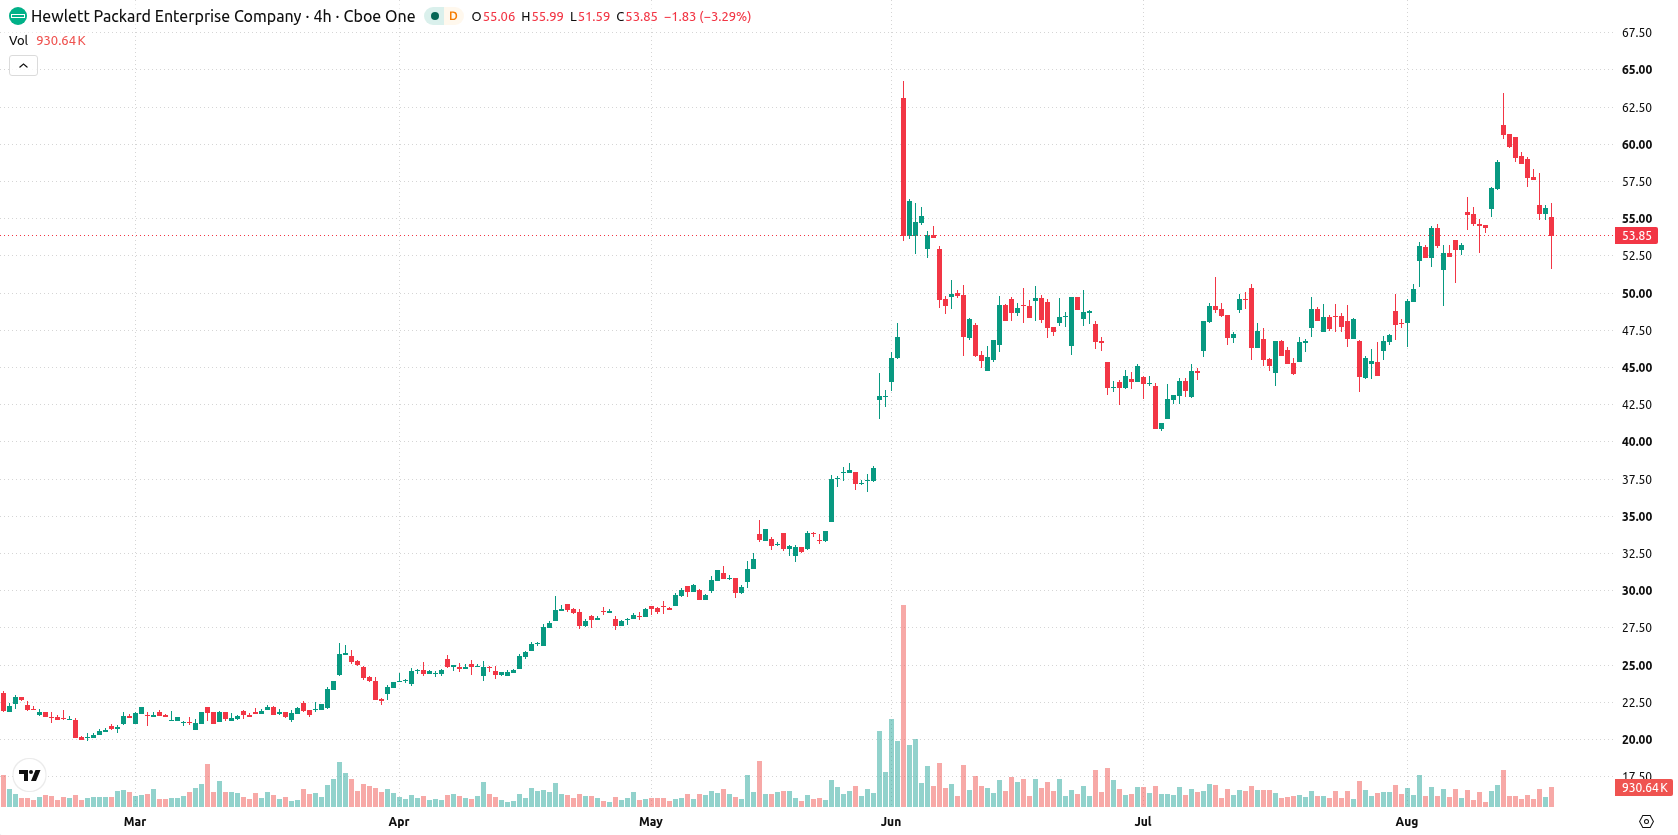
Hewlett Packard Enterprise Company (HPE) fell 3.54% after opening with a downside gap, even as recent institutional buying activity was disclosed. Today’s move contrasts with the stock’s established bullish technical alignment above key moving averages, which now serves to limit the depth of the decline.
 55.71
62.10
Highlights
- Pallas Capital Advisors LLC acquired 44,539 shares of Hewlett Packard Enterprise Company during the second quarter.
- Hewlett Packard Enterprise stock produced an average annual return of 30.65% over the past five years, turning $1,000 into $3,838.13.
- Hewlett Packard Enterprise stock maintains a bullish technical structure, with momentum indicators positive and the price expected to range from $49.43 to $58.01 in the next five days.
Broad gains since 2019 underperformed as selling pressure persists
Pallas Capital Advisors LLC was reported to have acquired 44,539 shares of Hewlett Packard Enterprise Company in the second quarter, according to a recent regulatory filing. Over the past five years, Hewlett Packard Enterprise stock recorded an average annual return of 30.65%. A $1,000 investment five years ago would have been valued at approximately $3,838.13, though price action has remained under broader selling pressure.
Mixed intraday signals as bullish structure faces volatility spike
Hewlett Packard Enterprise is trading above its 20-day ($51.89), 50-day ($48.72), and 200-day ($31.34) moving averages, which confirms a bullish structure across short-, medium-, and long-term horizons. Immediate technical focus is on the near-term ceiling at $54.87 and the Ichimoku Kijun floor at $53.37, with the longer-term bullish alignment of the 50-day relative to the 200-day average providing trend confirmation. Momentum signals are strong: the Moving Average Convergence Divergence (MACD) and Average Directional Index (ADX) both suggest continued buying interest. The Relative Strength Index (RSI) sits at 60.1 with a bullish forecast, and Commodity Channel Index (CCI) is also supportive, but the Stochastic RSI is neutral. Bull/Bear Power (BBP) is positive at 3.19, indicating dominance by buyers, but the overbought call signals potential exhaustion. The Awesome Oscillator (AO) remains on a buy signal, supporting the prevailing trend. Today, the stock is down $1.97 or 3.54%, opening with a downside gap of about $0.12 (–0.22%) and currently trading mid-range. Intraday volatility stands at 8.01%. Today’s tone is mixed with elevated volatility and some pressure after the open, with momentum signals mostly pointing higher even as intraday price retreats.
Earlier, analysts noted that sustained institutional accumulation and favorable technical momentum underpinned Hewlett Packard Enterprise's uptrend. The current environment adds heightened volatility and a mixed session to the outlook, with $54.87 as a pivotal ceiling to watch for confirmation of renewed upside.






Latest Hewlett Packard Enterprise Co News




-
 Afghanistan
-
 Albania
-
 Algeria
-
 Angola
-
 Argentina
-
 Armenia
-
 Australia
-
 Austria
-
 Azerbaijan
-
 Bahamas
-
 Bahrain
-
 Bangladesh
-
 Belarus
-
 Belgium
-
 Bolivia
-
 Botswana
-
 Brazil
-
 Brunei
-
 Bulgaria
-
 Cambodia
-
 Cameroon
-
 Canada
-
 Chile
-
 China
-
 Colombia
-
 Congo
-
 Costa Rica
-
 Cote d'Ivoire
-
 Croatia
-
 Cuba
-
 Cyprus
-
 Czechia
-
 DR Congo
-
 Denmark
-
 Dominican Republic
-
 Ecuador
-
 Egypt
-
 El Salvador
-
 Estonia
-
 Eswatini
-
 Ethiopia
-
 Finland
-
 France
-
 Georgia
-
 Germany
-
 Ghana
-
 Greece
-
 Haiti
-
 Hong Kong
-
 Hungary
-
 India
-
 Indonesia
-
 Iran, Islamic republic
-
 Iraq
-
 Ireland
-
 Israel
-
 Italy
-
 Jamaica
-
 Japan
-
 Jordan
-
 Kazakhstan
-
 Kenya
-
 Korea
-
 Kuwait
-
 Kyrgyzstan
-
 Laos
-
 Latvia
-
 Lebanon
-
 Lesotho
-
 Libya
-
 Lithuania
-
 Luxembourg
-
 Madagascar
-
 Malaysia
-
 Malta
-
 Mauritius
-
 Mexico
-
 Moldova
-
 Mongolia
-
 Montenegro
-
 Morocco
-
 Mozambique
-
 Myanmar
-
 Namibia
-
 Nepal
-
 Netherlands
-
 New Zealand
-
 Nigeria
-
 North Macedonia
-
 Norway
-
 Oman
-
 Pakistan
-
 Palestine
-
 Panama
-
 Papua New Guinea
-
 Paraguay
-
 Peru
-
 Philippines
-
 Poland
-
 Portugal
-
 Puerto Rico
-
 Qatar
-
 Reunion
-
 Romania
-
 Rwanda
-
 Saudi Arabia
-
 Serbia
-
 Singapore
-
 Slovakia
-
 Slovenia
-
 Somalia
-
 South Africa
-
 Spain
-
 Sri Lanka
-
 Sweden
-
 Switzerland
-
 Syria
-
 Taiwan
-
 Tajikistan
-
 Tanzania
-
 Thailand
-
 Trinidad and Tobago
-
 Tunisia
-
 Turkey
-
 UAE
-
 Uganda
-
 Ukraine
-
 United Kingdom
-
United States
-
 Uruguay
-
 Uzbekistan
-
 Venezuela
-
 Vietnam
-
 Yemen
-
 Zambia
-
 Zimbabwe
- Forex
- Crypto












