

Why is Zoom stock down today? Key support levels to watch

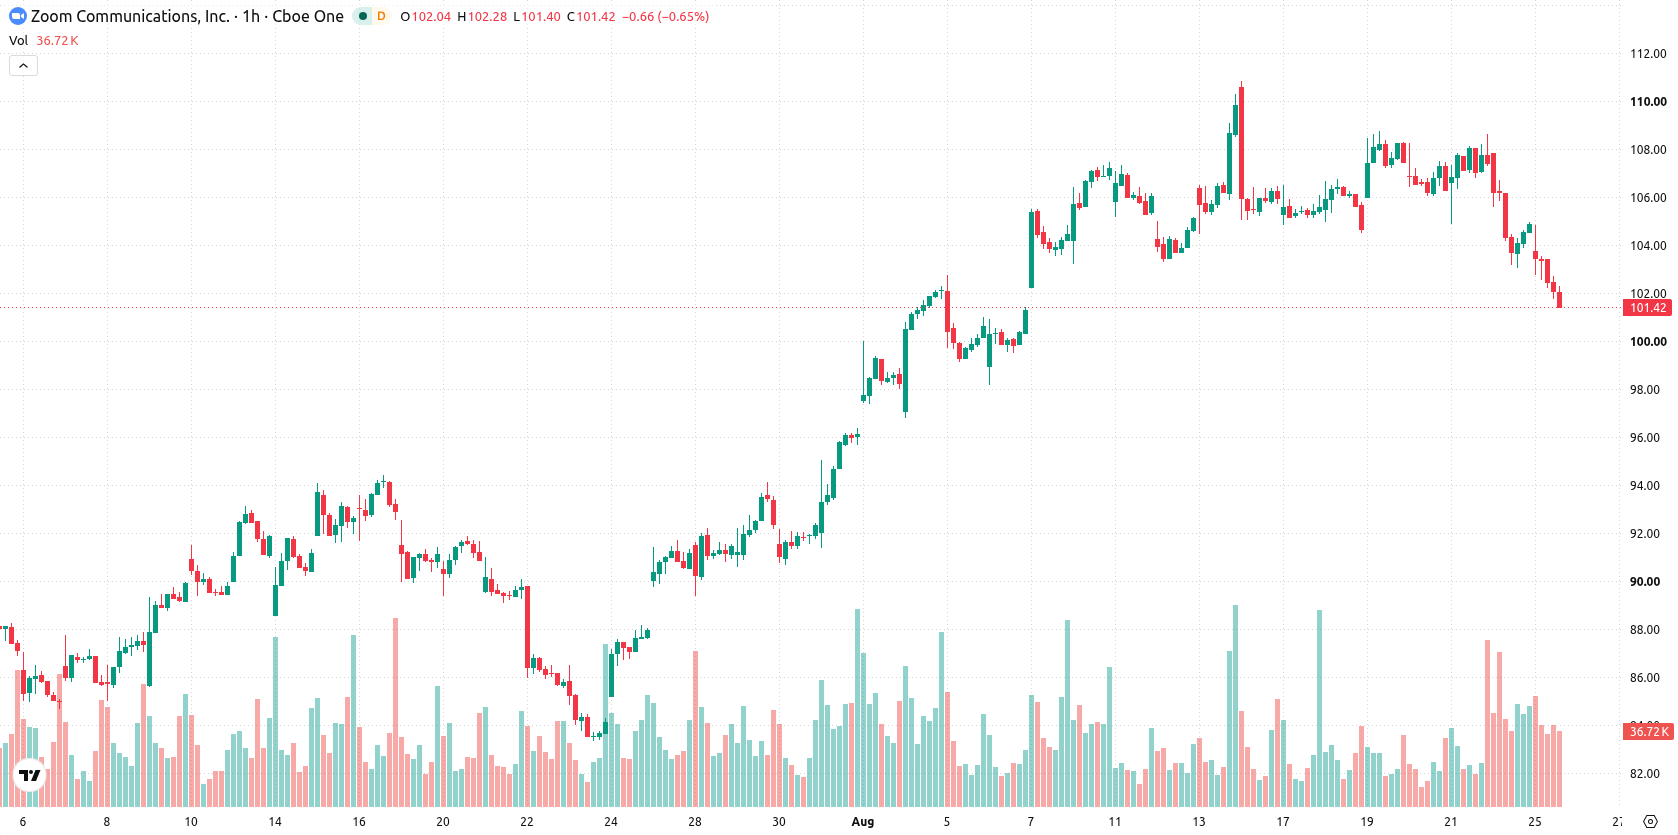
Zoom (ZM) stock is trading at $101.53, down 3.15% for the day, and is currently positioned below its key moving averages.
 99.16
99.88
99.16
99.88
Highlights
- ZM/USD trades below key short- and medium-term moving averages, indicating ongoing intraday and short-term bearish pressure.
- Momentum and oscillator signals, including RSI, MACD, and CCI, all indicate dominant seller activity and weak momentum.
- ZM/USD dropped 3.15% to $101.53 and is expected to consolidate between $98.95 and $104.27, with only a 25% probability of an upward move.
Bearish momentum dominates as key resistance contains rallies
On the technical front, ZM is trading below the MA-20 ($106.29) and MA-50 ($106.33) on the hourly chart, while remaining above the MA-200 ($89.78) on the daily chart. The next notable resistance is identified at the Ichimoku Kijun level of $105.9. Momentum indicators are weak, as both RSI (42.99) and MACD signal a sell bias. CCI and Bull/Bear Power readings are in oversold territory, reflecting dominant seller activity, whereas Stoch RSI and ADX are neutral. The Awesome Oscillator further confirms the prevailing bearish momentum.
Downside risk persists amid consolidation and narrow rebound odds
In the short term, ZM is expected to trade between $98.95 and $104.27, reflecting the typical volatility band relative to current levels. The probability of a further decline remains elevated, with a limited (25%) chance of a rebound. A break above $105.9 could initiate a bullish move, while sustained weakness below $98.95 may accelerate selling pressure. The baseline scenario anticipates price consolidation within the current range.
Earlier, analysts noted that Zoom shares were under near-term pressure but maintained longer-term support, emphasizing mixed technical signals ahead of key catalysts. The updated technical setup continues to favor downside risk, with traders advised to monitor the $98.95 support level for signs of increased selling pressure.










-
 Afghanistan
-
 Albania
-
 Algeria
-
 Angola
-
 Argentina
-
 Armenia
-
 Australia
-
 Austria
-
 Azerbaijan
-
 Bahamas
-
 Bahrain
-
 Bangladesh
-
 Belarus
-
 Belgium
-
 Bolivia
-
 Botswana
-
 Brazil
-
 Brunei
-
 Bulgaria
-
 Cambodia
-
 Cameroon
-
 Canada
-
 Chile
Chile
-
 China
China
-
 Colombia
-
 Congo
Congo
-
 Costa Rica
-
 Cote d'Ivoire
-
 Croatia
-
 Cuba
Cuba
-
 Cyprus
-
 Czechia
-
 DR Congo
-
 Denmark
-
 Dominican Republic
-
 Ecuador
-
 Egypt
Egypt
-
 El Salvador
-
 Estonia
-
 Eswatini
-
 Ethiopia
-
 Finland
-
 France
-
 Georgia
-
 Germany
-
 Ghana
Ghana
-
 Greece
-
 Haiti
Haiti
-
 Hong Kong
-
 Hungary
-
 India
India
-
 Indonesia
-
 Iran, Islamic republic
-
 Iraq
Iraq
-
 Ireland
-
 Israel
-
 Italy
Italy
-
 Jamaica
-
 Japan
Japan
-
 Jordan
-
 Kazakhstan
-
 Kenya
Kenya
-
 Korea
Korea
-
 Kuwait
-
 Kyrgyzstan
-
 Laos
Laos
-
 Latvia
-
 Lebanon
-
 Lesotho
-
 Libya
Libya
-
 Lithuania
-
 Luxembourg
-
 Madagascar
-
 Malaysia
-
 Malta
Malta
-
 Mauritius
-
 Mexico
-
 Moldova
-
 Mongolia
-
 Montenegro
-
 Morocco
-
 Mozambique
-
 Myanmar
-
 Namibia
-
 Nepal
Nepal
-
 Netherlands
-
 New Zealand
-
 Nigeria
-
 North Macedonia
-
 Norway
-
 Oman
Oman
-
 Pakistan
-
 Palestine
-
 Panama
-
 Papua New Guinea
-
 Paraguay
-
 Peru
Peru
-
 Philippines
-
 Poland
-
 Portugal
-
 Puerto Rico
-
 Qatar
Qatar
-
 Reunion
-
 Romania
-
 Rwanda
-
 Saudi Arabia
-
 Serbia
-
 Singapore
-
 Slovakia
-
 Slovenia
-
 Somalia
-
 South Africa
-
 Spain
Spain
-
 Sri Lanka
-
 Sweden
-
 Switzerland
-
 Syria
Syria
-
 Taiwan
-
 Tajikistan
-
 Tanzania
-
 Thailand
-
 Trinidad and Tobago
-
 Tunisia
-
 Turkey
-
 UAE
UAE
-
 Uganda
-
 Ukraine
-
 United Kingdom
-
United States
-
 Uruguay
-
 Uzbekistan
-
 Venezuela
-
 Vietnam
-
 Yemen
Yemen
-
 Zambia
-
 Zimbabwe
- Forex
- Crypto












