

Dividend increase to 48.49p supports National Grid stock near GBX1,176 support

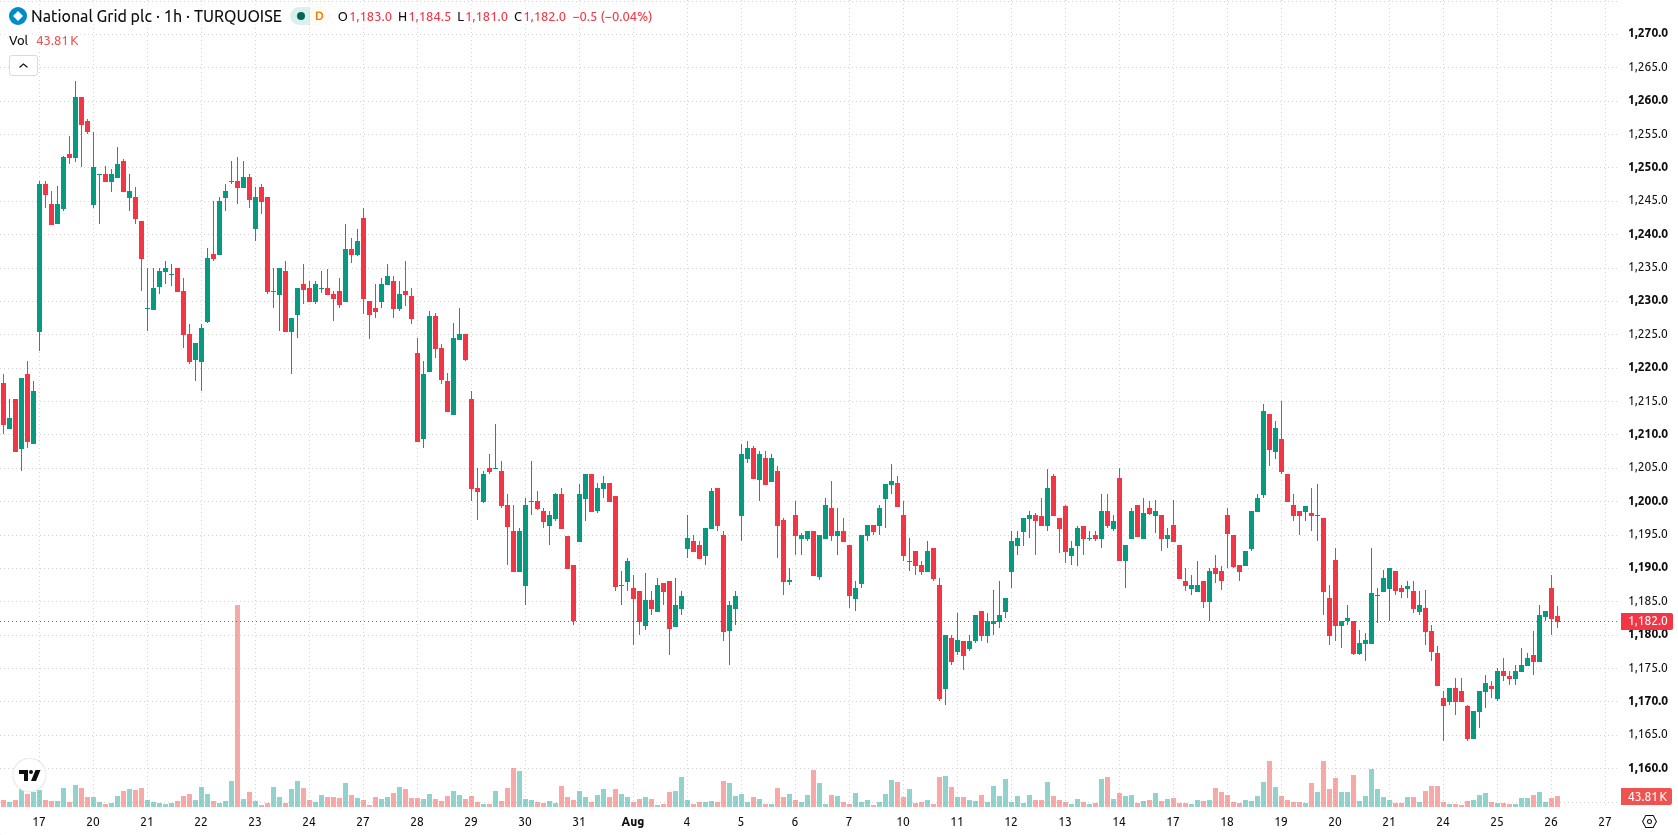
National Grid (NG) stock is trading at GBX1,179.50, edging modestly lower for the session. The price sits above its key short-term averages but remains below intermediate and long-term trend markers.
 1256.00
1262.50
Highlights
- National Grid announced a record £11.6 billion capital investment focused on long-term infrastructure and growth.
- The company raised its 2026 full-year dividend by 3.8% to 48.49p, confirming ongoing financial strength and focus on shareholder returns.
- Shares of National Grid are trading in a range of GBX1,165 to GBX1,193 with mixed technical signals and a higher likelihood of near-term downside.
Accelerated investment aims to drive growth and shareholder returns
National Grid has announced a record £11.6 billion capital investment, reflecting a significant commitment toward infrastructure expansion and underpinning its long-term growth agenda. This accelerated investment program is designed to drive future asset and earnings growth, reinforcing operational capabilities and broadening the company's development pipeline. In addition, the company increased its 2026 full-year dividend by 3.8% to 48.49p, indicating ongoing financial strength and a continued focus on shareholder returns. The combination of these measures highlights management's focus on future value creation through both asset expansion and income distribution.
Overbought signals emerge as intraday bias faces resistance
Technical levels for NG/GBX show the price above the MA-20 at GBX1,174, while still below both the MA-50 at GBX1,182 and MA-200 at GBX1,234. The Ichimoku Kijun line at GBX1,176 provides immediate support. Momentum indicators on the hourly timeframe are mixed, with MACD and ADX in neutral territory. RSI suggests mild buying conditions, but Stochastic RSI and CCI are both overbought along with Bull/Bear Power, underscoring strong intraday buyer activity. The Awesome Oscillator confirms an upward bias, yet the observed overbought oscillator readings alongside muted intraday performance point to a potential near-term pullback risk.
Range-bound outlook holds as downside risk outweighs bullish chances
In the short term, NG/GBX is expected to fluctuate within a range of GBX1,165 to GBX1,193, defining a narrow volatility band around current levels. The probability of further upward movement is currently estimated at 35%, while a 65% chance is assigned to a downward scenario. Stabilization within this corridor remains the baseline scenario; a sustained bullish move would require a decisive break above resistance, while renewed weakness is likely if prices slip below the immediate support levels.
Previously it was reported that National Grid shares were exhibiting weak momentum and a downside bias as they struggled to overcome resistance. The current analysis highlights that, while short-term technicals show improved support and mixed momentum, the prevailing scenario remains rangebound with a potential pullback risk if immediate support is breached.









-
 Afghanistan
-
 Albania
-
 Algeria
-
 Angola
-
 Argentina
-
 Armenia
-
 Australia
-
 Austria
-
 Azerbaijan
-
 Bahamas
-
 Bahrain
-
 Bangladesh
-
 Belarus
-
 Belgium
-
 Bolivia
-
 Botswana
-
 Brazil
-
 Brunei
-
 Bulgaria
-
 Cambodia
-
 Cameroon
-
 Canada
-
 Chile
-
 China
-
 Colombia
-
 Congo
-
 Costa Rica
-
 Cote d'Ivoire
-
 Croatia
-
 Cuba
-
 Cyprus
-
 Czechia
-
 DR Congo
-
 Denmark
-
 Dominican Republic
-
 Ecuador
-
 Egypt
-
 El Salvador
-
 Estonia
-
 Eswatini
-
 Ethiopia
-
 Finland
-
 France
-
 Georgia
-
 Germany
-
 Ghana
-
 Greece
-
 Haiti
-
 Hong Kong
-
 Hungary
-
 India
-
 Indonesia
-
 Iran, Islamic republic
-
 Iraq
-
 Ireland
-
 Israel
-
 Italy
-
 Jamaica
-
 Japan
-
 Jordan
-
 Kazakhstan
-
 Kenya
-
 Korea
-
 Kuwait
-
 Kyrgyzstan
-
 Laos
-
 Latvia
-
 Lebanon
-
 Lesotho
-
 Libya
-
 Lithuania
-
 Luxembourg
-
 Madagascar
-
 Malaysia
-
 Malta
-
 Mauritius
-
 Mexico
-
 Moldova
-
 Mongolia
-
 Montenegro
-
 Morocco
-
 Mozambique
-
 Myanmar
-
 Namibia
-
 Nepal
-
 Netherlands
-
 New Zealand
-
 Nigeria
-
 North Macedonia
-
 Norway
-
 Oman
-
 Pakistan
-
 Palestine
-
 Panama
-
 Papua New Guinea
-
 Paraguay
-
 Peru
-
 Philippines
-
 Poland
-
 Portugal
-
 Puerto Rico
-
 Qatar
-
 Reunion
-
 Romania
-
 Rwanda
-
 Saudi Arabia
-
 Serbia
-
 Singapore
-
 Slovakia
-
 Slovenia
-
 Somalia
-
 South Africa
-
 Spain
-
 Sri Lanka
-
 Sweden
-
 Switzerland
-
 Syria
-
 Taiwan
-
 Tajikistan
-
 Tanzania
-
 Thailand
-
 Trinidad and Tobago
-
 Tunisia
-
 Turkey
-
 UAE
-
 Uganda
-
 Ukraine
-
 United Kingdom
-
United States
-
 Uruguay
-
 Uzbekistan
-
 Venezuela
-
 Vietnam
-
 Yemen
-
 Zambia
-
 Zimbabwe
- Forex
- Crypto












