


Eli Lilly and Company (LLY) dropped 3.48% following a surge in selling pressure as the stock failed to reclaim its 20-day moving average, even as strong second-quarter results highlighted robust revenue growth and new product developments. The selloff contradicts the underlying bullish technical structure, with medium- and long-term trends still supported by key indicators and higher moving averages.
 1436.72
Highlights
- Eli Lilly revenue jumped 48% in Q2 2026, powered by strong sales of Mounjaro, Zepbound, and international growth.
- Citadel expanded its Eli Lilly stock position nearly fourfold, reaching $1.18 billion, as the company advanced new pipeline assets.
- Eli Lilly stock trades below $1,200 resistance with a projected 5-day range of $1,145 to $1,215 and a strong probability of upside movement.
Profit-taking and reimbursement risks weigh on Citadel-backed rally
Eli Lilly reported strong financial performance in Q2 2026, with revenue rising by 48% primarily on sales of Mounjaro and Zepbound alongside international market expansion. Citadel nearly quadrupled its position in the company during the period, reaching holdings valued at $1.18 billion. The company completed a Phase 1 clinical study of pipeline candidate LY4395089 and launched the weight-loss pill Foundayo in the UK. Recent profit-taking and reimbursement concerns have accompanied the otherwise robust operating backdrop, though price action has remained under broader selling pressure.
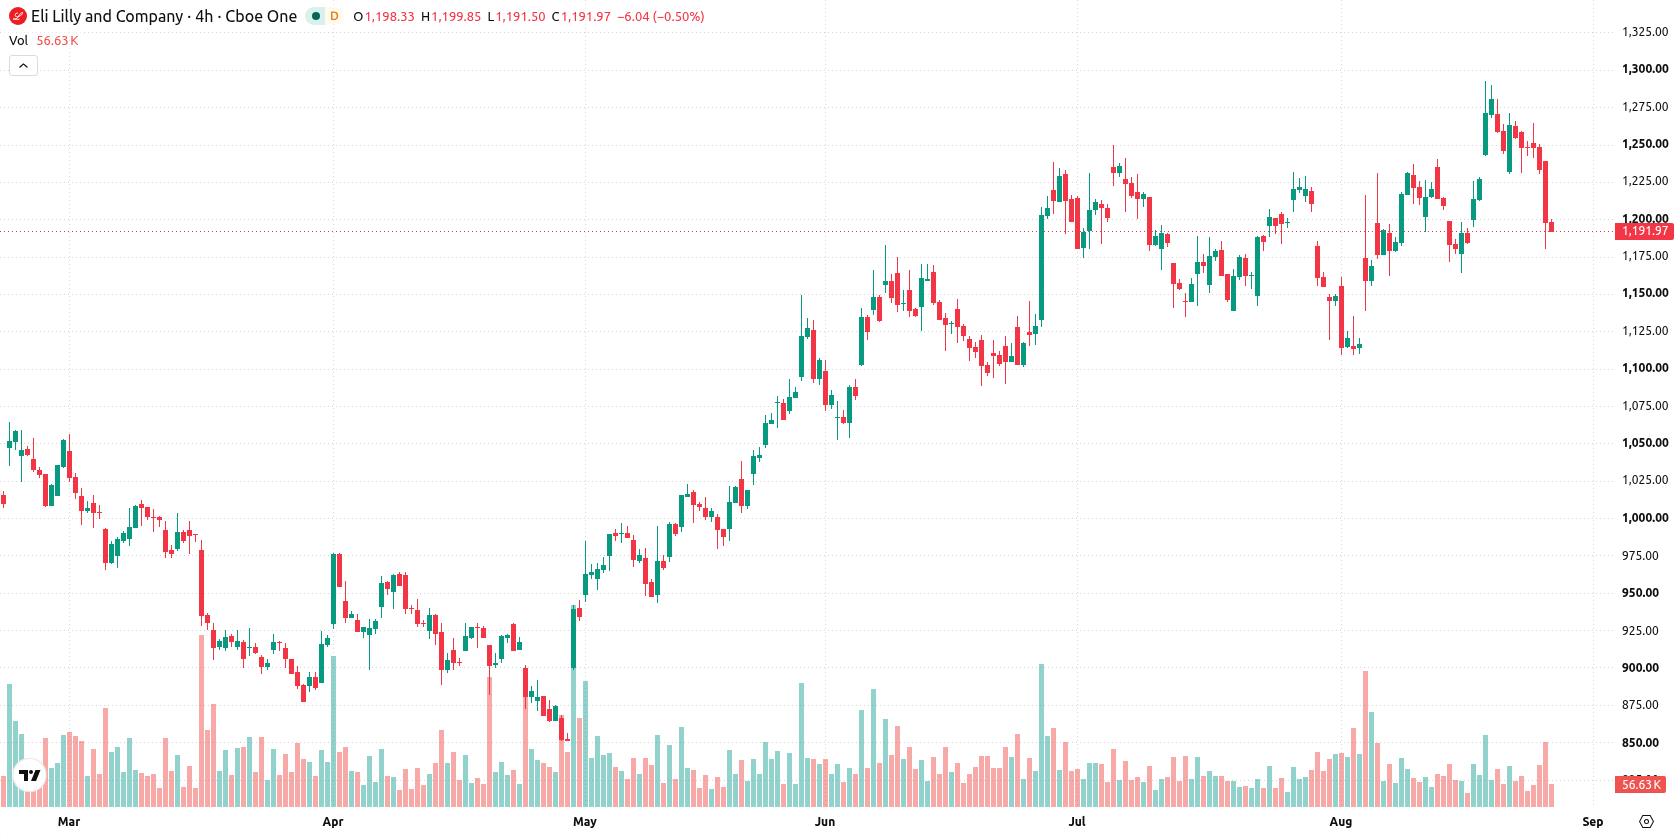
Near-term weakness persists amid bullish medium-term momentum
LLY is trading below the 20-day moving average at $1,200 but remains above the 50-day and 200-day averages at $1,181 and $1,054, respectively, indicating near-term technical pressure from sellers yet reinforcing a bullish medium- and long-term trend structure. $1,200 acts as immediate resistance with $1,181 as nearby support. The MACD and ADX continue to issue buy signals. The RSI and CCI are positioned in the upper half of their ranges, pointing to moderate buying strength without signs of overextension, while the Stochastic RSI is neutral. Bull/Bear Power (BBP) remains positive, showing ongoing intraday momentum in favor of buyers but flagging overbought conditions. The Awesome Oscillator (AO) points to a general uptrend. Today, LLY lost $42.95 or 3.48%, trading near session lows after an upside gap of 1.24%. Intraday volatility stands at 2.84%. The session reflects a sharp turn to selling pressure against lingering bullish signals.
Previously it was reported that Eli Lilly faced ongoing selling pressure despite strong fundamentals and institutional accumulation, with technical analysis pointing to a consolidation phase. The latest developments confirm that, while near-term volatility persists, traders should closely monitor the $1,200 resistance and $1,145 support as pivotal levels guiding the next directional move.






Latest Eli Lilly and Company News




-
 Afghanistan
-
 Albania
-
 Algeria
-
 Angola
-
 Argentina
-
 Armenia
-
 Australia
-
 Austria
-
 Azerbaijan
-
 Bahamas
-
 Bahrain
-
 Bangladesh
-
 Belarus
-
 Belgium
-
 Bolivia
-
 Botswana
-
 Brazil
-
 Brunei
-
 Bulgaria
-
 Cambodia
-
 Cameroon
-
 Canada
-
 Chile
-
 China
-
 Colombia
-
 Congo
-
 Costa Rica
-
 Cote d'Ivoire
-
 Croatia
-
 Cuba
-
 Cyprus
-
 Czechia
-
 DR Congo
-
 Denmark
-
 Dominican Republic
-
 Ecuador
-
 Egypt
-
 El Salvador
-
 Estonia
-
 Eswatini
-
 Ethiopia
-
 Finland
-
 France
-
 Georgia
-
 Germany
-
 Ghana
-
 Greece
-
 Haiti
-
 Hong Kong
-
 Hungary
-
 India
-
 Indonesia
-
 Iran, Islamic republic
-
 Iraq
-
 Ireland
-
 Israel
-
 Italy
-
 Jamaica
-
 Japan
-
 Jordan
-
 Kazakhstan
-
 Kenya
-
 Korea
-
 Kuwait
-
 Kyrgyzstan
-
 Laos
-
 Latvia
-
 Lebanon
-
 Lesotho
-
 Libya
-
 Lithuania
-
 Luxembourg
-
 Madagascar
-
 Malaysia
-
 Malta
-
 Mauritius
-
 Mexico
-
 Moldova
-
 Mongolia
-
 Montenegro
-
 Morocco
-
 Mozambique
-
 Myanmar
-
 Namibia
-
 Nepal
-
 Netherlands
-
 New Zealand
-
 Nigeria
-
 North Macedonia
-
 Norway
-
 Oman
-
 Pakistan
-
 Palestine
-
 Panama
-
 Papua New Guinea
-
 Paraguay
-
 Peru
-
 Philippines
-
 Poland
-
 Portugal
-
 Puerto Rico
-
 Qatar
-
 Reunion
-
 Romania
-
 Rwanda
-
 Saudi Arabia
-
 Serbia
-
 Singapore
-
 Slovakia
-
 Slovenia
-
 Somalia
-
 South Africa
-
 Spain
-
 Sri Lanka
-
 Sweden
-
 Switzerland
-
 Syria
-
 Taiwan
-
 Tajikistan
-
 Tanzania
-
 Thailand
-
 Trinidad and Tobago
-
 Tunisia
-
 Turkey
-
 UAE
-
 Uganda
-
 Ukraine
-
 United Kingdom
-
United States
-
 Uruguay
-
 Uzbekistan
-
 Venezuela
-
 Vietnam
-
 Yemen
-
 Zambia
-
 Zimbabwe
- Forex
- Crypto












