

Eli Lilly stock direction in limbo amid diverging MACD and HMA signals: weekly analysis

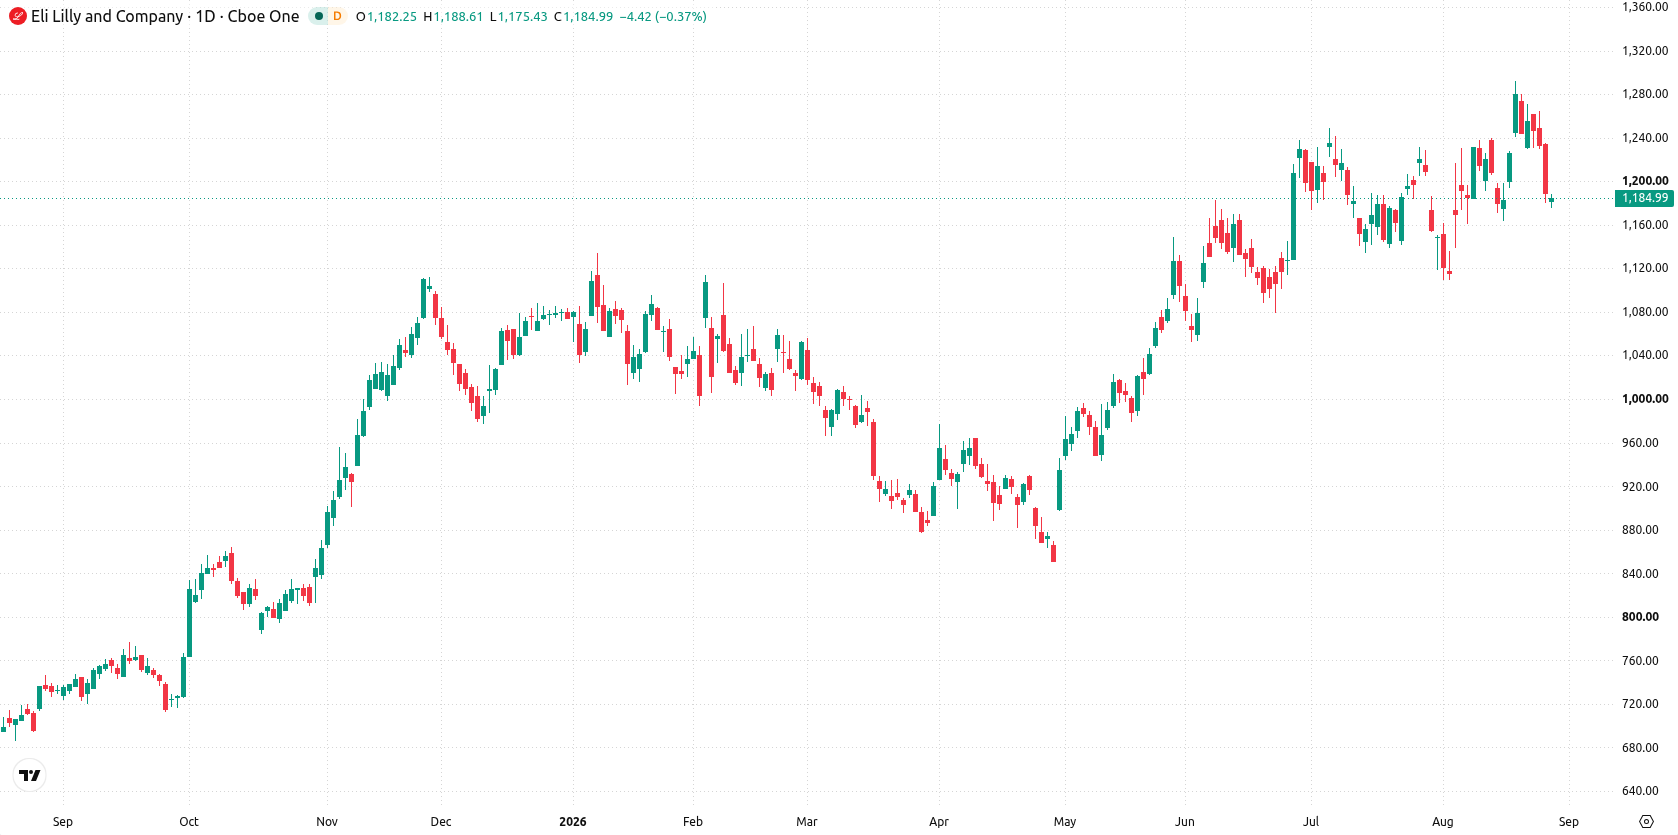
Shares of Eli Lilly and Company (LLY) are trading near $1,185 after falling more than 5% in the past week, as buyers struggled to regain control amid mixed technical signals. The daily chart highlights conflicting momentum with key indicators diverging, leaving the setup in limbo and prompting traders to watch closely for decisiveness in the days ahead.
 1274.54
1275.30
1274.54
1275.30
Highlights
- Shares of Eli Lilly have fallen 5.53% over the past 7 days and are now testing key short-term support.
- Technical signals are mixed, with momentum showing both buy and sell indications and no clear edge from oscillators.
- The stock is expected to trade between $1,144 and $1,226 in the coming week, with a 62% probability of an increase.
UK approval and R&D deals drive optimism as obesity drug franchise expands
LLY advanced its obesity treatment franchise as the UK Medicines and Healthcare products Regulatory Agency approved Foundayo, marking Britain as the first European market to offer this once-daily oral drug for weight management and type 2 diabetes, according to Reuters. The commercial rollout, initially via private prescription, strengthens LLY's foothold in this fast-expanding segment. The company also reported Q2 2026 revenue growth of 48% year-over-year and broadened its pipeline with new R&D agreements in Alzheimer’s and vaccines.
Support tested and volatility rises as mixed signals cloud technical outlook
On the daily chart, the structure reflects a test of key support as volatility over the past week reached 7.75%. Momentum signals are mixed: while MACD forecasts a buy, the HMA points to sell, highlighting a divergence as the move develops. The RSI at 55.33 sits in neutral, indicating no clear momentum edge from this oscillator. Support is established at $1,183 (MA-50), with resistance at $1,200 (Ichimoku Kijun) capping immediate upside. This backdrop sets up an emerging move lower that is not yet confirmed, suggesting traders should watch for resolution at these levels.
Range-bound bias this week as breakout risks hinge on key levels
For the coming trading week, the expected range is $1,144 to $1,226, with a 62% probability of an increase and a 38% chance of a decrease. The base case sees the stock holding between $1,183 support and $1,200 resistance. A bullish scenario emerges on a sustained move above $1,200, opening potential for further gains toward the top of the expected range. A bearish outcome unfolds if shares fall decisively below $1,183, exposing the lower boundary at $1,144.
Previously it was reported that Eli Lilly shares were under near-term selling pressure despite strong company fundamentals and a constructive broader trend. The current setup builds on this outlook, with volatility persisting at key levels and suggesting that traders should monitor the $1,183 support and $1,200 resistance for early signals of the next directional move.




Latest Eli Lilly and Company News





-
 Afghanistan
-
 Albania
-
 Algeria
-
 Angola
-
 Argentina
-
 Armenia
-
 Australia
-
 Austria
-
 Azerbaijan
-
 Bahamas
-
 Bahrain
-
 Bangladesh
-
 Belarus
-
 Belgium
-
 Bolivia
-
 Botswana
-
 Brazil
-
 Brunei
-
 Bulgaria
-
 Cambodia
-
 Cameroon
-
 Canada
-
 Chile
Chile
-
 China
China
-
 Colombia
-
 Congo
Congo
-
 Costa Rica
-
 Cote d'Ivoire
-
 Croatia
-
 Cuba
Cuba
-
 Cyprus
-
 Czechia
-
 DR Congo
-
 Denmark
-
 Dominican Republic
-
 Ecuador
-
 Egypt
Egypt
-
 El Salvador
-
 Estonia
-
 Eswatini
-
 Ethiopia
-
 Finland
-
 France
-
 Georgia
-
 Germany
-
 Ghana
Ghana
-
 Greece
-
 Haiti
Haiti
-
 Hong Kong
-
 Hungary
-
 India
India
-
 Indonesia
-
 Iran, Islamic republic
-
 Iraq
Iraq
-
 Ireland
-
 Israel
-
 Italy
Italy
-
 Jamaica
-
 Japan
Japan
-
 Jordan
-
 Kazakhstan
-
 Kenya
Kenya
-
 Korea
Korea
-
 Kuwait
-
 Kyrgyzstan
-
 Laos
Laos
-
 Latvia
-
 Lebanon
-
 Lesotho
-
 Libya
Libya
-
 Lithuania
-
 Luxembourg
-
 Madagascar
-
 Malaysia
-
 Malta
Malta
-
 Mauritius
-
 Mexico
-
 Moldova
-
 Mongolia
-
 Montenegro
-
 Morocco
-
 Mozambique
-
 Myanmar
-
 Namibia
-
 Nepal
Nepal
-
 Netherlands
-
 New Zealand
-
 Nigeria
-
 North Macedonia
-
 Norway
-
 Oman
Oman
-
 Pakistan
-
 Palestine
-
 Panama
-
 Papua New Guinea
-
 Paraguay
-
 Peru
Peru
-
 Philippines
-
 Poland
-
 Portugal
-
 Puerto Rico
-
 Qatar
Qatar
-
 Reunion
-
 Romania
-
 Rwanda
-
 Saudi Arabia
-
 Serbia
-
 Singapore
-
 Slovakia
-
 Slovenia
-
 Somalia
-
 South Africa
-
 Spain
Spain
-
 Sri Lanka
-
 Sweden
-
 Switzerland
-
 Syria
Syria
-
 Taiwan
-
 Tajikistan
-
 Tanzania
-
 Thailand
-
 Trinidad and Tobago
-
 Tunisia
-
 Turkey
-
 UAE
UAE
-
 Uganda
-
 Ukraine
-
 United Kingdom
-
United States
-
 Uruguay
-
 Uzbekistan
-
 Venezuela
-
 Vietnam
-
 Yemen
Yemen
-
 Zambia
-
 Zimbabwe
- Forex
- Crypto












