

Will Eli Lilly stock break resistance as earnings and ETF inflows drive strong sentiment?

Eli Lilly (LLY) stock is trading at $1,264, up 4.4% on the day and currently near the session high. The price sits above its key moving averages, indicating solid momentum over multiple timeframes.
 1274.54
1275.30
1274.54
1275.30
Highlights
- Eli Lilly stock is closely watched before its third quarter earnings report on October 29, 2026, with investor positioning rising.
- Recent 13F filings and $88.8 million in net ETF inflows over five days indicate increased institutional and fund demand.
- Shares trade in a bullish structure near session highs, with a projected range of $1,210 to $1,290 and overbought signals emerging.
Institutional inflows and earnings optimism as catalysts for sentiment shift
Eli Lilly is drawing heightened attention ahead of its scheduled third quarter earnings report on October 29, 2026, with the event prominently flagged by Yahoo Finance as a key catalyst. The company's previously reported annual revenue of $65.18 billion and net profit of $20.64 billion provide a strong financial base that anchors investor confidence. Institutional interest continues to build, as recent 13F filings compiled by MarketBeat highlight new and expanded positions across several asset managers, while Gurufocus reports $88.8 million in net ETF inflows over five consecutive days, reflecting broad-based demand from both funds and direct holders. Anticipation of these factors and strong product-driven expectations for Mounjaro and Zepbound are fueling the current upswing in sentiment.
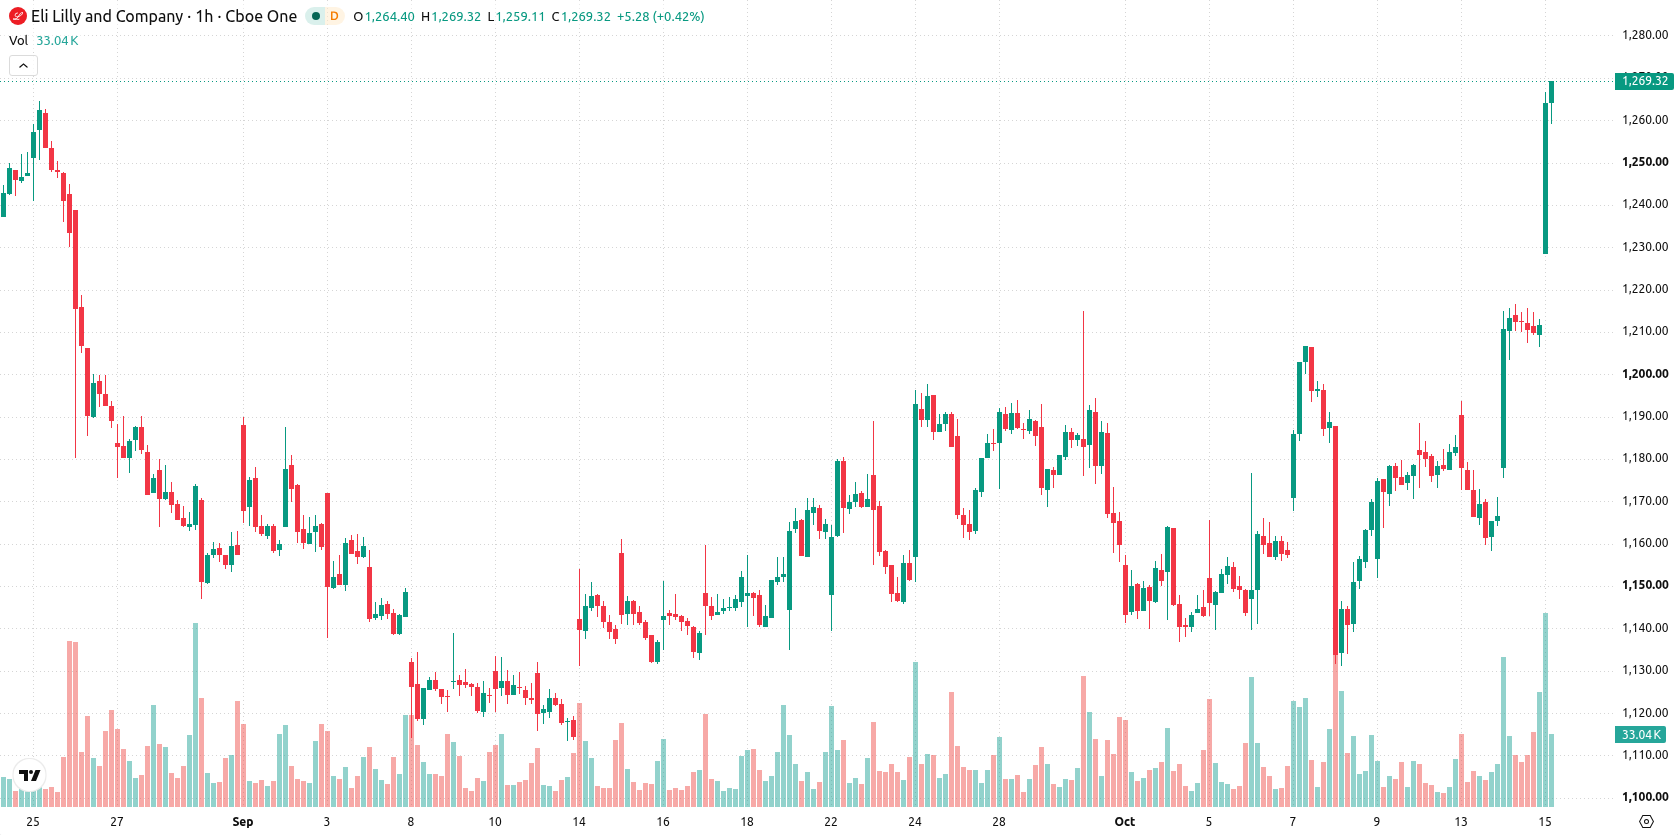
Bullish momentum faces overbought risk as technical levels hold
On the technical front, LLY is trading above its MA-20 ($1,186) and MA-50 ($1,176) on the hourly chart, remaining well above the MA-200 ($1,078) on the daily timeframe. The Ichimoku Kijun at $1,187 now acts as immediate support. Momentum indicators are robust, with MACD and ADX generating buy signals and Commodity Channel Index (CCI) also reading bullish. RSI stands at 67.48 and Stoch RSI is in overbought territory, signalling that the asset may be approaching short-term exhaustion; however, Bull/Bear Power data confirms strong buying pressure on intraday momentum. The Awesome Oscillator is neutral, and overbought oscillators introduce the risk of a pullback even as underlying signals remain positive.
Volatility band likely to persist barring breakout or support breach
Looking ahead to the next several sessions, LLY is expected to trade within a range of $1,210 to $1,290, which represents the typical volatility band relative to current levels. The baseline scenario is for the asset to remain inside this channel given the strong technical structure. A break above resistance could see prices extend higher in a bullish scenario, while a drop below $1,210 would open the risk of a deeper correction.
Earlier, analysts noted that Eli Lilly shares were consolidating with the outlook hinging on technical strength and key catalysts. The current technical momentum and heightened institutional activity suggest traders should watch for a confirmed move outside the $1,210–$1,290 volatility band as earnings approach.




Latest Eli Lilly and Company News






-
 Afghanistan
-
 Albania
-
 Algeria
-
 Angola
-
 Argentina
-
 Armenia
-
 Australia
-
 Austria
-
 Azerbaijan
-
 Bahamas
-
 Bahrain
-
 Bangladesh
-
 Belarus
-
 Belgium
-
 Bolivia
-
 Botswana
-
 Brazil
-
 Brunei
-
 Bulgaria
-
 Cambodia
-
 Cameroon
-
 Canada
-
 Chile
Chile
-
 China
China
-
 Colombia
-
 Congo
Congo
-
 Costa Rica
-
 Cote d'Ivoire
-
 Croatia
-
 Cuba
Cuba
-
 Cyprus
-
 Czechia
-
 DR Congo
-
 Denmark
-
 Dominican Republic
-
 Ecuador
-
 Egypt
Egypt
-
 El Salvador
-
 Estonia
-
 Eswatini
-
 Ethiopia
-
 Finland
-
 France
-
 Georgia
-
 Germany
-
 Ghana
Ghana
-
 Greece
-
 Haiti
Haiti
-
 Hong Kong
-
 Hungary
-
 India
India
-
 Indonesia
-
 Iran, Islamic republic
-
 Iraq
Iraq
-
 Ireland
-
 Israel
-
 Italy
Italy
-
 Jamaica
-
 Japan
Japan
-
 Jordan
-
 Kazakhstan
-
 Kenya
Kenya
-
 Korea
Korea
-
 Kuwait
-
 Kyrgyzstan
-
 Laos
Laos
-
 Latvia
-
 Lebanon
-
 Lesotho
-
 Libya
Libya
-
 Lithuania
-
 Luxembourg
-
 Madagascar
-
 Malaysia
-
 Malta
Malta
-
 Mauritius
-
 Mexico
-
 Moldova
-
 Mongolia
-
 Montenegro
-
 Morocco
-
 Mozambique
-
 Myanmar
-
 Namibia
-
 Nepal
Nepal
-
 Netherlands
-
 New Zealand
-
 Nigeria
-
 North Macedonia
-
 Norway
-
 Oman
Oman
-
 Pakistan
-
 Palestine
-
 Panama
-
 Papua New Guinea
-
 Paraguay
-
 Peru
Peru
-
 Philippines
-
 Poland
-
 Portugal
-
 Puerto Rico
-
 Qatar
Qatar
-
 Reunion
-
 Romania
-
 Rwanda
-
 Saudi Arabia
-
 Serbia
-
 Singapore
-
 Slovakia
-
 Slovenia
-
 Somalia
-
 South Africa
-
 Spain
Spain
-
 Sri Lanka
-
 Sweden
-
 Switzerland
-
 Syria
Syria
-
 Taiwan
-
 Tajikistan
-
 Tanzania
-
 Thailand
-
 Trinidad and Tobago
-
 Tunisia
-
 Turkey
-
 UAE
UAE
-
 Uganda
-
 Ukraine
-
 United Kingdom
-
United States
-
 Uruguay
-
 Uzbekistan
-
 Venezuela
-
 Vietnam
-
 Yemen
Yemen
-
 Zambia
-
 Zimbabwe
- Forex
- Crypto












