

MSTR slips as paused bitcoin purchases signal cautious capital use

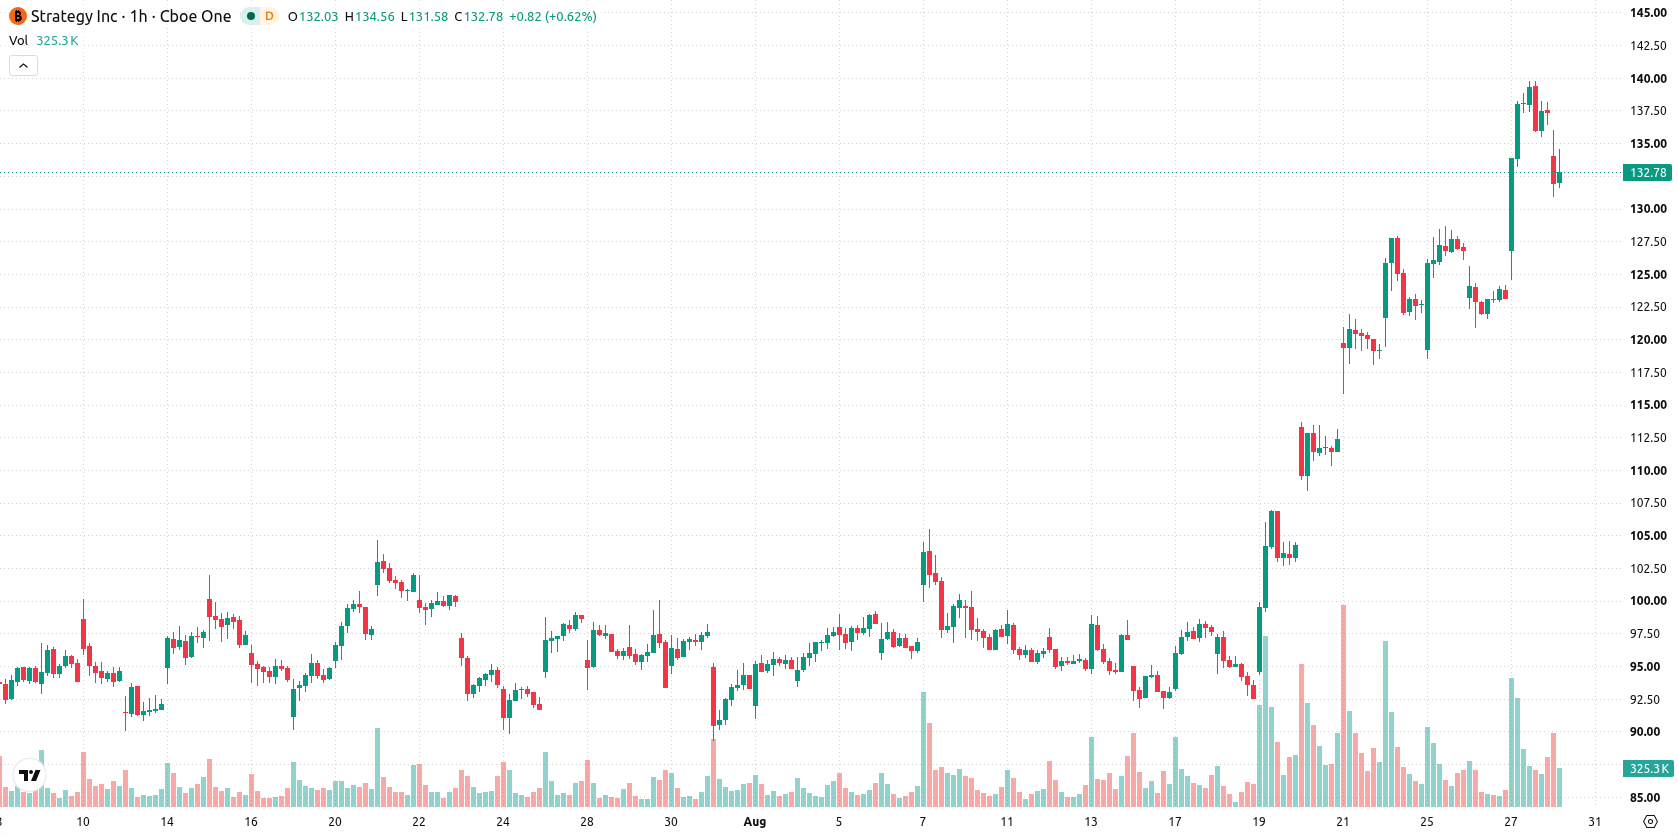
Strategy Incorporated (MSTR, formerly MicroStrategy) stock is trading at $133.63, marking a daily decline of 2.75%. The price is currently holding above its key short- and medium-term moving averages, but remains capped below longer-term benchmarks.
 134.51
144.69
Highlights
- Strategy Inc. holds $1.59 billion in cash within a broader $5.1 billion reserve, maintaining liquidity to support obligations and flexibility.
- The company paused its bitcoin purchases for the week, keeping holdings at 840,447 BTC and signaling a more measured capital deployment.
- Technical indicators show short-term bullish momentum amid overbought conditions, with a projected MSTR/USD trading range of $124.34 to $142.92 over the next 2 to 3 days.
Cash reserves rise as bitcoin buying pauses amid debt concerns
Strategy Inc. has established a USD Cash pool of approximately $1.59 billion alongside a larger $5.1 billion reserve, providing significant liquidity to support its corporate obligations and strategic flexibility. The company paused bitcoin purchases for the week of August 17–23, maintaining its holdings at 840,447 BTC, indicating a more cautious approach to capital deployment. Beincrypto reports that these liquidity actions have brought Strategy’s cash reserves nearly in line with its $6.75 billion in debt, reducing market concerns about forced bitcoin sales, though price action has remained under broader selling pressure.
Overbought oscillators clash with bullish momentum on mixed signals
On the hourly timeframe, MSTR is trading above its MA-20 at $129.14 and MA-50 at $120.31, while remaining below the MA-200 at $141.6. The Ichimoku Kijun level at $129.1 acts as immediate support. Momentum indicators provide a mixed technical picture: MACD and ADX display buy signals, while RSI is strongly overbought at 71.92 and CCI is also in overbought territory. Stochastic RSI is neutral, Bull/Bear Power is overbought, and the Awesome Oscillator remains neutral. Today’s session has seen a notable 10.63-point opening gap and elevated volatility, with some divergence as overbought oscillators contrast with ongoing bullish momentum readings, suggesting caution for new long positions.
Volatility band guides near-term move as breakout risk remains
In the short term, MSTR is expected to trade within a volatility band of $124.34 to $142.92 over the next 2–3 days. There is a 65% probability of further upward movement and a 35% chance of a decline. The baseline scenario calls for price to remain within this corridor. Should the price break above resistance, a new upswing could develop; conversely, a break below support may accelerate downside momentum.
Earlier, analysts noted that Strategy’s share price was consolidating as the company boosted liquidity and maintained operational flexibility, while remaining constrained by long-term resistance levels. The current analysis adds that overbought technical signals and heightened volatility now warrant close attention to potential momentum shifts, with traders advised to watch for a breakout above $142.92 or a drop below $124.34 as catalysts for the next directional move.






Latest Strategy News



-
 Afghanistan
-
 Albania
-
 Algeria
-
 Angola
-
 Argentina
-
 Armenia
-
 Australia
-
 Austria
-
 Azerbaijan
-
 Bahamas
-
 Bahrain
-
 Bangladesh
-
 Belarus
-
 Belgium
-
 Bolivia
-
 Botswana
-
 Brazil
-
 Brunei
-
 Bulgaria
-
 Cambodia
-
 Cameroon
-
 Canada
-
 Chile
-
 China
-
 Colombia
-
 Congo
-
 Costa Rica
-
 Cote d'Ivoire
-
 Croatia
-
 Cuba
-
 Cyprus
-
 Czechia
-
 DR Congo
-
 Denmark
-
 Dominican Republic
-
 Ecuador
-
 Egypt
-
 El Salvador
-
 Estonia
-
 Eswatini
-
 Ethiopia
-
 Finland
-
 France
-
 Georgia
-
 Germany
-
 Ghana
-
 Greece
-
 Haiti
-
 Hong Kong
-
 Hungary
-
 India
-
 Indonesia
-
 Iran, Islamic republic
-
 Iraq
-
 Ireland
-
 Israel
-
 Italy
-
 Jamaica
-
 Japan
-
 Jordan
-
 Kazakhstan
-
 Kenya
-
 Korea
-
 Kuwait
-
 Kyrgyzstan
-
 Laos
-
 Latvia
-
 Lebanon
-
 Lesotho
-
 Libya
-
 Lithuania
-
 Luxembourg
-
 Madagascar
-
 Malaysia
-
 Malta
-
 Mauritius
-
 Mexico
-
 Moldova
-
 Mongolia
-
 Montenegro
-
 Morocco
-
 Mozambique
-
 Myanmar
-
 Namibia
-
 Nepal
-
 Netherlands
-
 New Zealand
-
 Nigeria
-
 North Macedonia
-
 Norway
-
 Oman
-
 Pakistan
-
 Palestine
-
 Panama
-
 Papua New Guinea
-
 Paraguay
-
 Peru
-
 Philippines
-
 Poland
-
 Portugal
-
 Puerto Rico
-
 Qatar
-
 Reunion
-
 Romania
-
 Rwanda
-
 Saudi Arabia
-
 Serbia
-
 Singapore
-
 Slovakia
-
 Slovenia
-
 Somalia
-
 South Africa
-
 Spain
-
 Sri Lanka
-
 Sweden
-
 Switzerland
-
 Syria
-
 Taiwan
-
 Tajikistan
-
 Tanzania
-
 Thailand
-
 Trinidad and Tobago
-
 Tunisia
-
 Turkey
-
 UAE
-
 Uganda
-
 Ukraine
-
 United Kingdom
-
United States
-
 Uruguay
-
 Uzbekistan
-
 Venezuela
-
 Vietnam
-
 Yemen
-
 Zambia
-
 Zimbabwe
- Forex
- Crypto












