

Fiscal 2026 restructuring charges weigh on Synopsys stock below $429.66 support

Synopsys (SNPS) stock is trading at $440.97, reflecting a daily loss of 5.15%. The price currently sits above its key short- and medium-term moving averages, but remains under its longer-term levels.
 473.66
491.23
Highlights
- Synopsys reported fiscal Q3 2026 revenue of $2.477 billion, up 42% year-over-year, and raised full-year guidance.
- Management now expects restructuring charges of $425 million to $500 million for fiscal 2026, mainly from higher severance and facility closures.
- Shares of Synopsys are experiencing selling pressure, trading near session lows, with strong short- and medium-term momentum but ongoing long-term resistance; the expected price range for coming days is $406.73 to $475.21.
Growth outlook bolstered by raised forecasts and restructuring charges
Synopsys posted its fiscal third-quarter 2026 results, recording $2.477 billion in revenue, a 42% increase year-over-year, and reported non-GAAP EPS of $3.91 with GAAP EPS of $2.84. The company also raised its full-year 2026 revenue and EPS guidance, indicating management's expectation of continued robust growth driven by strong underlying demand. In addition, Synopsys increased its estimated pre-tax GAAP restructuring charges for fiscal 2026 to $425–$500 million, reflecting higher anticipated severance costs and facility closures, which may pressure near-term margins. These actions provide a fundamentally positive backdrop, though price action has remained under broader selling pressure.
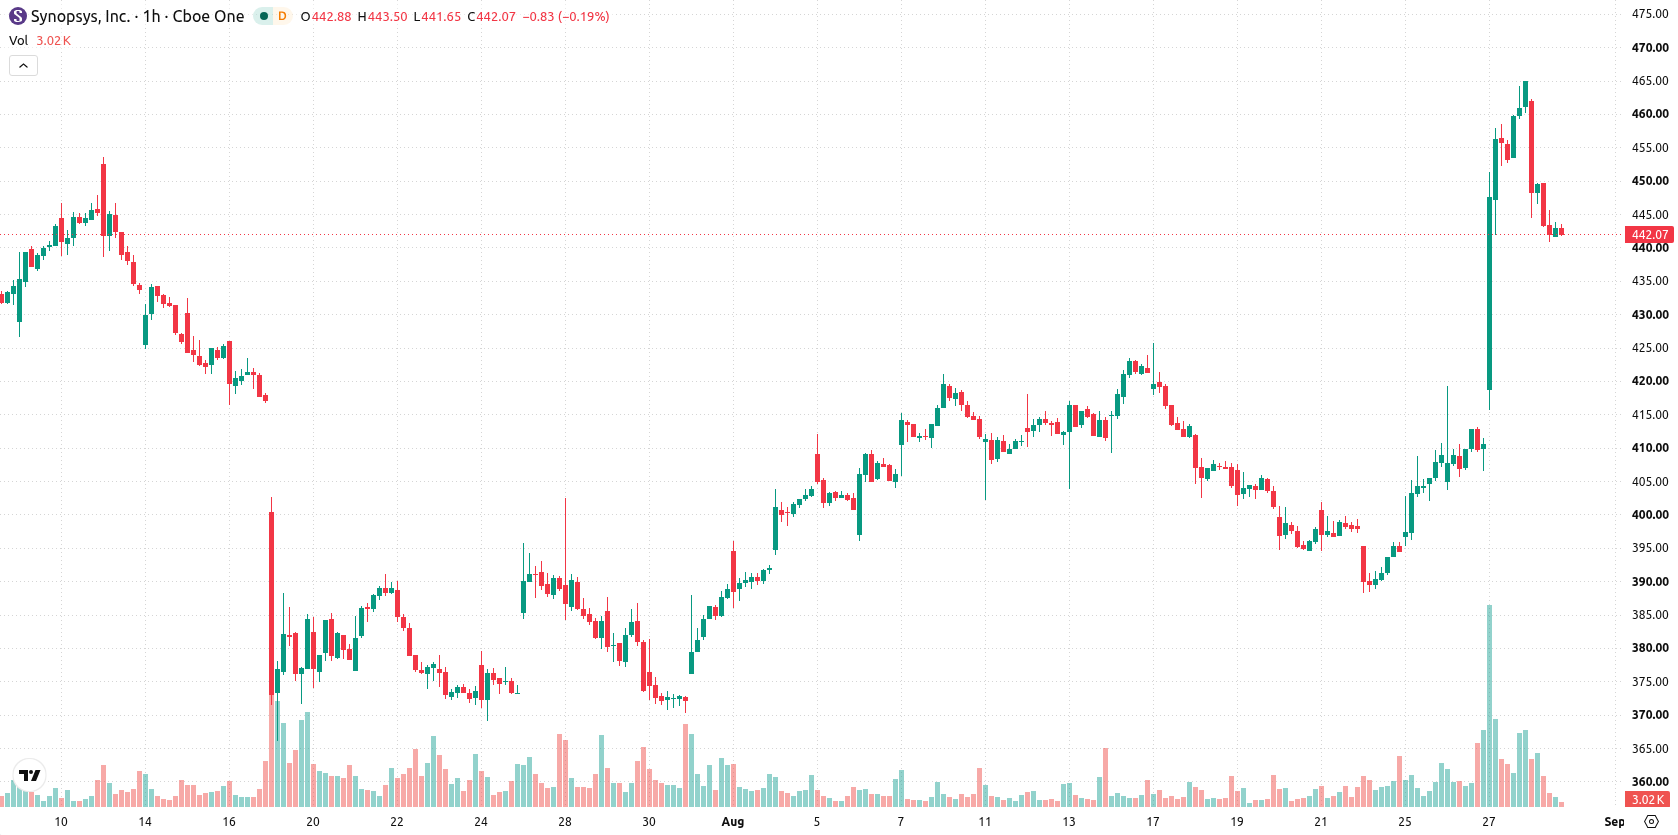
Upward bias persists as mixed oscillators temper momentum signals
SNPS trades above its MA-20 at $433.5 and MA-50 at $412.09, while remaining below the MA-200 at $446.42. The Ichimoku Kijun sits at $429.66 and acts as immediate support. MACD is giving a strong buy signal and ADX is also in buy mode, highlighting ongoing upward momentum; RSI remains in buy territory. However, Stoch RSI and Bull/Bear Power both reflect oversold conditions, while CCI and Awesome Oscillator are neutral, indicating mixed oscillator signals following today's move.
Sideways consolidation anticipated amid bullish rebound potential
Over the next few trading sessions, SNPS is expected to consolidate within a price range of $406.73 to $475.21, representing its prevailing volatility band. The likelihood of an upward move toward the upper end of the corridor is approximately 75%, while further downside toward the range low is less likely at 25%. Baseline expectations call for a period of sideways price action, with a rebound scenario targeting resistance at the top of the range and a bearish case involving a breach of immediate support.
Previously it was reported that Synopsys shares experienced heightened volatility and selling pressure following strong earnings and updated guidance, as investors weighed restructuring costs and integration challenges. The current setup introduces mixed technical signals amid consolidation, making the response to immediate support near $429.66 a critical level to watch for direction in the days ahead.






Latest Synopsys News



-
 Afghanistan
-
 Albania
-
 Algeria
-
 Angola
-
 Argentina
-
 Armenia
-
 Australia
-
 Austria
-
 Azerbaijan
-
 Bahamas
-
 Bahrain
-
 Bangladesh
-
 Belarus
-
 Belgium
-
 Bolivia
-
 Botswana
-
 Brazil
-
 Brunei
-
 Bulgaria
-
 Cambodia
-
 Cameroon
-
 Canada
-
 Chile
-
 China
-
 Colombia
-
 Congo
-
 Costa Rica
-
 Cote d'Ivoire
-
 Croatia
-
 Cuba
-
 Cyprus
-
 Czechia
-
 DR Congo
-
 Denmark
-
 Dominican Republic
-
 Ecuador
-
 Egypt
-
 El Salvador
-
 Estonia
-
 Eswatini
-
 Ethiopia
-
 Finland
-
 France
-
 Georgia
-
 Germany
-
 Ghana
-
 Greece
-
 Haiti
-
 Hong Kong
-
 Hungary
-
 India
-
 Indonesia
-
 Iran, Islamic republic
-
 Iraq
-
 Ireland
-
 Israel
-
 Italy
-
 Jamaica
-
 Japan
-
 Jordan
-
 Kazakhstan
-
 Kenya
-
 Korea
-
 Kuwait
-
 Kyrgyzstan
-
 Laos
-
 Latvia
-
 Lebanon
-
 Lesotho
-
 Libya
-
 Lithuania
-
 Luxembourg
-
 Madagascar
-
 Malaysia
-
 Malta
-
 Mauritius
-
 Mexico
-
 Moldova
-
 Mongolia
-
 Montenegro
-
 Morocco
-
 Mozambique
-
 Myanmar
-
 Namibia
-
 Nepal
-
 Netherlands
-
 New Zealand
-
 Nigeria
-
 North Macedonia
-
 Norway
-
 Oman
-
 Pakistan
-
 Palestine
-
 Panama
-
 Papua New Guinea
-
 Paraguay
-
 Peru
-
 Philippines
-
 Poland
-
 Portugal
-
 Puerto Rico
-
 Qatar
-
 Reunion
-
 Romania
-
 Rwanda
-
 Saudi Arabia
-
 Serbia
-
 Singapore
-
 Slovakia
-
 Slovenia
-
 Somalia
-
 South Africa
-
 Spain
-
 Sri Lanka
-
 Sweden
-
 Switzerland
-
 Syria
-
 Taiwan
-
 Tajikistan
-
 Tanzania
-
 Thailand
-
 Trinidad and Tobago
-
 Tunisia
-
 Turkey
-
 UAE
-
 Uganda
-
 Ukraine
-
 United Kingdom
-
United States
-
 Uruguay
-
 Uzbekistan
-
 Venezuela
-
 Vietnam
-
 Yemen
-
 Zambia
-
 Zimbabwe
- Forex
- Crypto












