

HAL climbs nearly 3% after positive quarterly earnings and new Brazil contract

Halliburton Company (HAL) surged 2.72% following a pre-market rally driven by stronger oil prices after renewed Middle East tensions and a series of positive company updates. The move is supported by the stock’s bullish technical setup above key moving averages, though the longer-term trend context remains bearish.
 32.63
35.90
Highlights
- Halliburton stock rose after second-quarter earnings per share of $0.55 and revenue of $5.71 billion beat estimates with 3.7% growth.
- The company declared a quarterly dividend of $0.17 per share with an ex-dividend date of September 2 and secured an integrated BP contract in Brazil.
- Shares trade with bullish momentum above key averages, in an overbought zone, with a forecast range of $35.49 to $38.83 for the next five days.
Earnings and contract wins fuel institutional buying and sector optimism
Halliburton reported second-quarter earnings on July 21, posting $0.55 earnings per share and $5.71 billion in revenue, both exceeding analyst expectations and reflecting 3.7% year-over-year growth. The company declared a quarterly dividend of $0.17 per share, payable on September 23, and an ex-dividend date of September 2. Institutional interest was highlighted by Kingsview Wealth Management LLC’s acquisition of 102,121 shares in the second quarter, and Halliburton secured an integrated contract with BP for work at the Bumerangue field offshore Brazil.
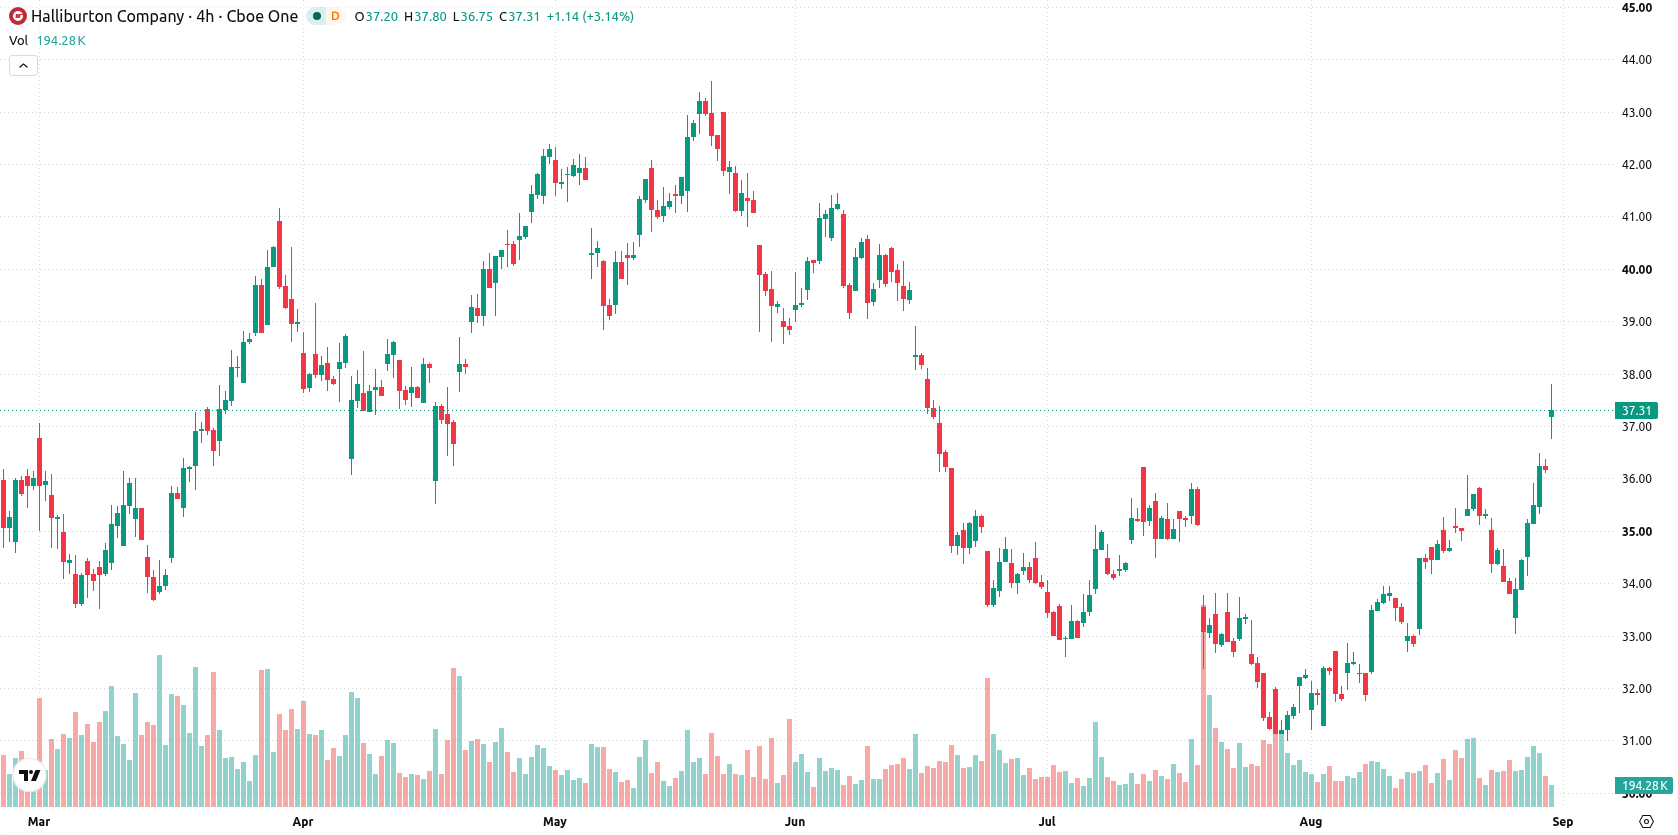
Bullish momentum moderates as overbought signals and resistance converge
Halliburton is trading above its 20-day, 50-day, and 200-day moving averages ($33.92, $33.85, and $34.55), indicating bullish momentum across short-, medium-, and long-term trends. The near-term ceiling is set at $37.77 with support at $36.82. The long-term trend context remains bearish based on the alignment of the 50-day and 200-day moving averages. Momentum signals are mostly constructive: the MACD points to a buying bias, and the ADX suggests limited trend strength. The RSI stands at 61.44, within the buy zone, while the Stochastic RSI and CCI readings of 96.96 and 128.52 respectively indicate a deeply overbought condition. Bull/Bear Power shows buyers dominating intraday momentum at 1.83, also in overbought territory. The price currently trades mid-session with steady participation, though overbought oscillators signal a risk of near-term pullback.
Earlier, analysts noted that TJX Companies raised its fiscal outlook following tariff refunds, even as some segments underperformed expectations. In Halliburton’s case, while the technicals suggest near-term bullish momentum, traders should monitor the $37.77 resistance level closely, as price action above this threshold could indicate a potential breakout from the current trading range.






Latest Halliburton Company News




-
 Afghanistan
-
 Albania
-
 Algeria
-
 Angola
-
 Argentina
-
 Armenia
-
 Australia
-
 Austria
-
 Azerbaijan
-
 Bahamas
-
 Bahrain
-
 Bangladesh
-
 Belarus
-
 Belgium
-
 Bolivia
-
 Botswana
-
 Brazil
-
 Brunei
-
 Bulgaria
-
 Cambodia
-
 Cameroon
-
 Canada
-
 Chile
-
 China
-
 Colombia
-
 Congo
-
 Costa Rica
-
 Cote d'Ivoire
-
 Croatia
-
 Cuba
-
 Cyprus
-
 Czechia
-
 DR Congo
-
 Denmark
-
 Dominican Republic
-
 Ecuador
-
 Egypt
-
 El Salvador
-
 Estonia
-
 Eswatini
-
 Ethiopia
-
 Finland
-
 France
-
 Georgia
-
 Germany
-
 Ghana
-
 Greece
-
 Haiti
-
 Hong Kong
-
 Hungary
-
 India
-
 Indonesia
-
 Iran, Islamic republic
-
 Iraq
-
 Ireland
-
 Israel
-
 Italy
-
 Jamaica
-
 Japan
-
 Jordan
-
 Kazakhstan
-
 Kenya
-
 Korea
-
 Kuwait
-
 Kyrgyzstan
-
 Laos
-
 Latvia
-
 Lebanon
-
 Lesotho
-
 Libya
-
 Lithuania
-
 Luxembourg
-
 Madagascar
-
 Malaysia
-
 Malta
-
 Mauritius
-
 Mexico
-
 Moldova
-
 Mongolia
-
 Montenegro
-
 Morocco
-
 Mozambique
-
 Myanmar
-
 Namibia
-
 Nepal
-
 Netherlands
-
 New Zealand
-
 Nigeria
-
 North Macedonia
-
 Norway
-
 Oman
-
 Pakistan
-
 Palestine
-
 Panama
-
 Papua New Guinea
-
 Paraguay
-
 Peru
-
 Philippines
-
 Poland
-
 Portugal
-
 Puerto Rico
-
 Qatar
-
 Reunion
-
 Romania
-
 Rwanda
-
 Saudi Arabia
-
 Serbia
-
 Singapore
-
 Slovakia
-
 Slovenia
-
 Somalia
-
 South Africa
-
 Spain
-
 Sri Lanka
-
 Sweden
-
 Switzerland
-
 Syria
-
 Taiwan
-
 Tajikistan
-
 Tanzania
-
 Thailand
-
 Trinidad and Tobago
-
 Tunisia
-
 Turkey
-
 UAE
-
 Uganda
-
 Ukraine
-
 United Kingdom
-
United States
-
 Uruguay
-
 Uzbekistan
-
 Venezuela
-
 Vietnam
-
 Yemen
-
 Zambia
-
 Zimbabwe
- Forex
- Crypto












