

Why is Agnico Eagle Mines stock rising today? U.S. Treasury news and C$278.4 resistance focus

Agnico Eagle Mines (AEM) stock is trading at C$277.54, having risen 1.99% on the session. The price remains below its short- and medium-term moving averages while holding above the long-term average.
 237.81
256.51
Highlights
- Shares of Agnico Eagle Mines have rebounded over 30% in the past year, tracking gold price moves linked to U.S. Treasury announcements.
- Strategic continuity and operational stability persist under President and CEO Ammar Al-Joundi since February 2022.
- AEM/CAD trades below short- and medium-term moving averages with weak momentum indicators, projecting a likely consolidation between C$269.5 and C$285.58 over the next four trading days.
Policy-driven gold prices shape fundamentals amid leadership stability
Agnico Eagle Mines has delivered a rebound of over 30% in the past year, with its performance closely linked to U.S. Treasury announcements that have influenced gold prices, as noted by Seeking Alpha. This alignment between policy-driven gold price moves and the value of gold producers has translated into stronger fundamentals for the company. Additionally, the ongoing leadership of Ammar Al-Joundi, who has served as President and CEO since February 2022 according to Miningdigital, has maintained strategic continuity and operational stability.
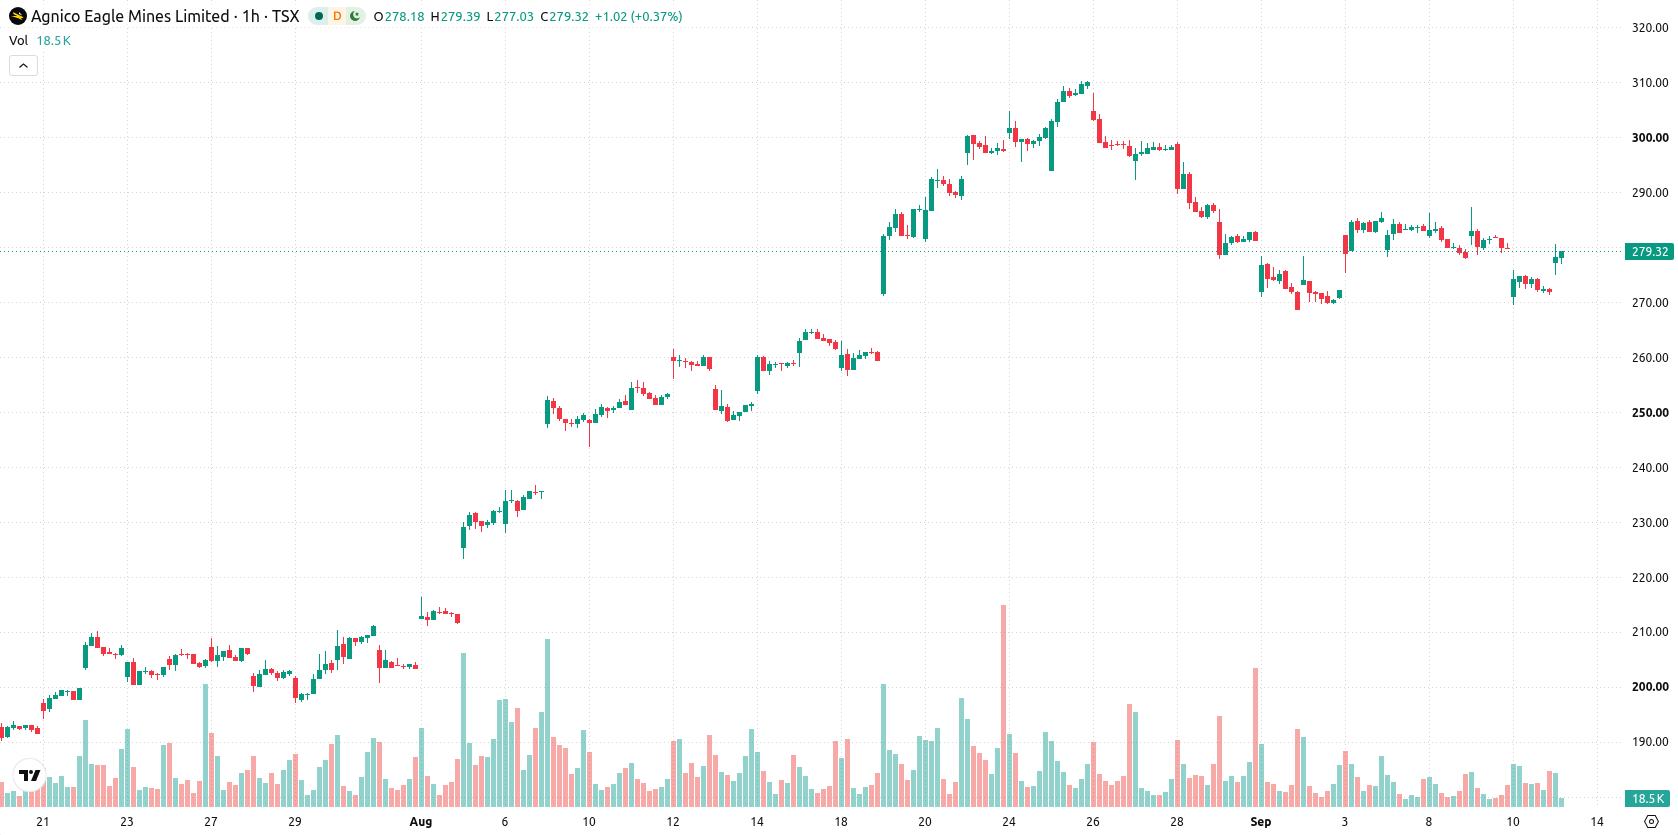
Oversold momentum diverges from close near session highs
Technically, AEM/CAD trades below its MA-20 and MA-50, indicating short- and medium-term weakness, but remains above the long-term MA-200. The Ichimoku Kijun line at C$278.4 marks immediate resistance. Key momentum indicators, including RSI, Stochastic RSI, CCI, and Bull/Bear Power, all signal an oversold, seller-dominated environment. MACD suggests further selling pressure, while ADX reflects neutral trend strength, and the Awesome Oscillator confirms prevailing downside momentum. Despite a gain for the day and a close near session highs, these readings highlight sharp divergence between price action and underlying momentum.
Consolidation outlook as range set by technical barriers
In the short term, the forecast projects AEM/CAD trading within a range of C$269.5 to C$285.58 over the next four sessions, consistent with typical volatility relative to current levels. There is a moderate probability (57%) of an upward move within this corridor, while the chance of a downward move is less likely at 43%. The baseline expectation is for consolidation, but a break above C$278.4 would open a bullish scenario, while a fall below the lower range boundary could trigger a bearish extension.
Earlier, analysts noted that Agnico Eagle Mines was experiencing persistent short-term selling pressure despite underlying operational stability and mixed technical signals. The current analysis signals that, while consolidation remains the most likely scenario, monitoring a potential break above C$278.4 or below C$269.5 is crucial for anticipating the next directional move.






Latest Agnico Eagle News




-
 Afghanistan
-
 Albania
-
 Algeria
-
 Angola
-
 Argentina
-
 Armenia
-
 Australia
-
 Austria
-
 Azerbaijan
-
 Bahamas
-
 Bahrain
-
 Bangladesh
-
 Belarus
-
 Belgium
-
 Bolivia
-
 Botswana
-
 Brazil
-
 Brunei
-
 Bulgaria
-
 Cambodia
-
 Cameroon
-
 Canada
-
 Chile
-
 China
-
 Colombia
-
 Congo
-
 Costa Rica
-
 Cote d'Ivoire
-
 Croatia
-
 Cuba
-
 Cyprus
-
 Czechia
-
 DR Congo
-
 Denmark
-
 Dominican Republic
-
 Ecuador
-
 Egypt
-
 El Salvador
-
 Estonia
-
 Eswatini
-
 Ethiopia
-
 Finland
-
 France
-
 Georgia
-
 Germany
-
 Ghana
-
 Greece
-
 Haiti
-
 Hong Kong
-
 Hungary
-
 India
-
 Indonesia
-
 Iran, Islamic republic
-
 Iraq
-
 Ireland
-
 Israel
-
 Italy
-
 Jamaica
-
 Japan
-
 Jordan
-
 Kazakhstan
-
 Kenya
-
 Korea
-
 Kuwait
-
 Kyrgyzstan
-
 Laos
-
 Latvia
-
 Lebanon
-
 Lesotho
-
 Libya
-
 Lithuania
-
 Luxembourg
-
 Madagascar
-
 Malaysia
-
 Malta
-
 Mauritius
-
 Mexico
-
 Moldova
-
 Mongolia
-
 Montenegro
-
 Morocco
-
 Mozambique
-
 Myanmar
-
 Namibia
-
 Nepal
-
 Netherlands
-
 New Zealand
-
 Nigeria
-
 North Macedonia
-
 Norway
-
 Oman
-
 Pakistan
-
 Palestine
-
 Panama
-
 Papua New Guinea
-
 Paraguay
-
 Peru
-
 Philippines
-
 Poland
-
 Portugal
-
 Puerto Rico
-
 Qatar
-
 Reunion
-
 Romania
-
 Rwanda
-
 Saudi Arabia
-
 Serbia
-
 Singapore
-
 Slovakia
-
 Slovenia
-
 Somalia
-
 South Africa
-
 Spain
-
 Sri Lanka
-
 Sweden
-
 Switzerland
-
 Syria
-
 Taiwan
-
 Tajikistan
-
 Tanzania
-
 Thailand
-
 Trinidad and Tobago
-
 Tunisia
-
 Turkey
-
 UAE
-
 Uganda
-
 Ukraine
-
 United Kingdom
-
United States
-
 Uruguay
-
 Uzbekistan
-
 Venezuela
-
 Vietnam
-
 Yemen
-
 Zambia
-
 Zimbabwe
- Forex
- Crypto












