

AI chip advancements unveiled: INTC resistance levels in focus

Intel (INTC) stock is trading at $101.46, having gained 4.45% on the day and closing near its session high. The price sits above its key moving averages on both the hourly and daily charts, highlighting strength relative to short-, medium-, and long-term trends.
 64.75
95.68
Highlights
- Intel has advanced its AI chip portfolio and is targeting both established and emerging artificial intelligence hardware markets.
- The Terafab foundry initiative represents increased investment in manufacturing capacity to support supply chain resilience and high-growth industry opportunities.
- Shares of Intel surged 4.45% to $101.46 with high volatility, but negative short-term momentum suggests a higher likelihood of prices moving within $95.14 to $105.95.
AI chip launch and foundry expansion drive demand and resilience
Intel has introduced its latest AI chip advancements, reflecting tangible progress in its efforts to accelerate development of artificial intelligence hardware, according to Stockstotrade. This move is expected to drive new demand as the company’s AI products enter both established and emerging market segments. In addition, Intel’s rollout of the Terafab foundry initiative highlights an expanded investment in manufacturing capabilities that supports future supply chain resilience and positions the firm to capture opportunities in high-growth verticals.
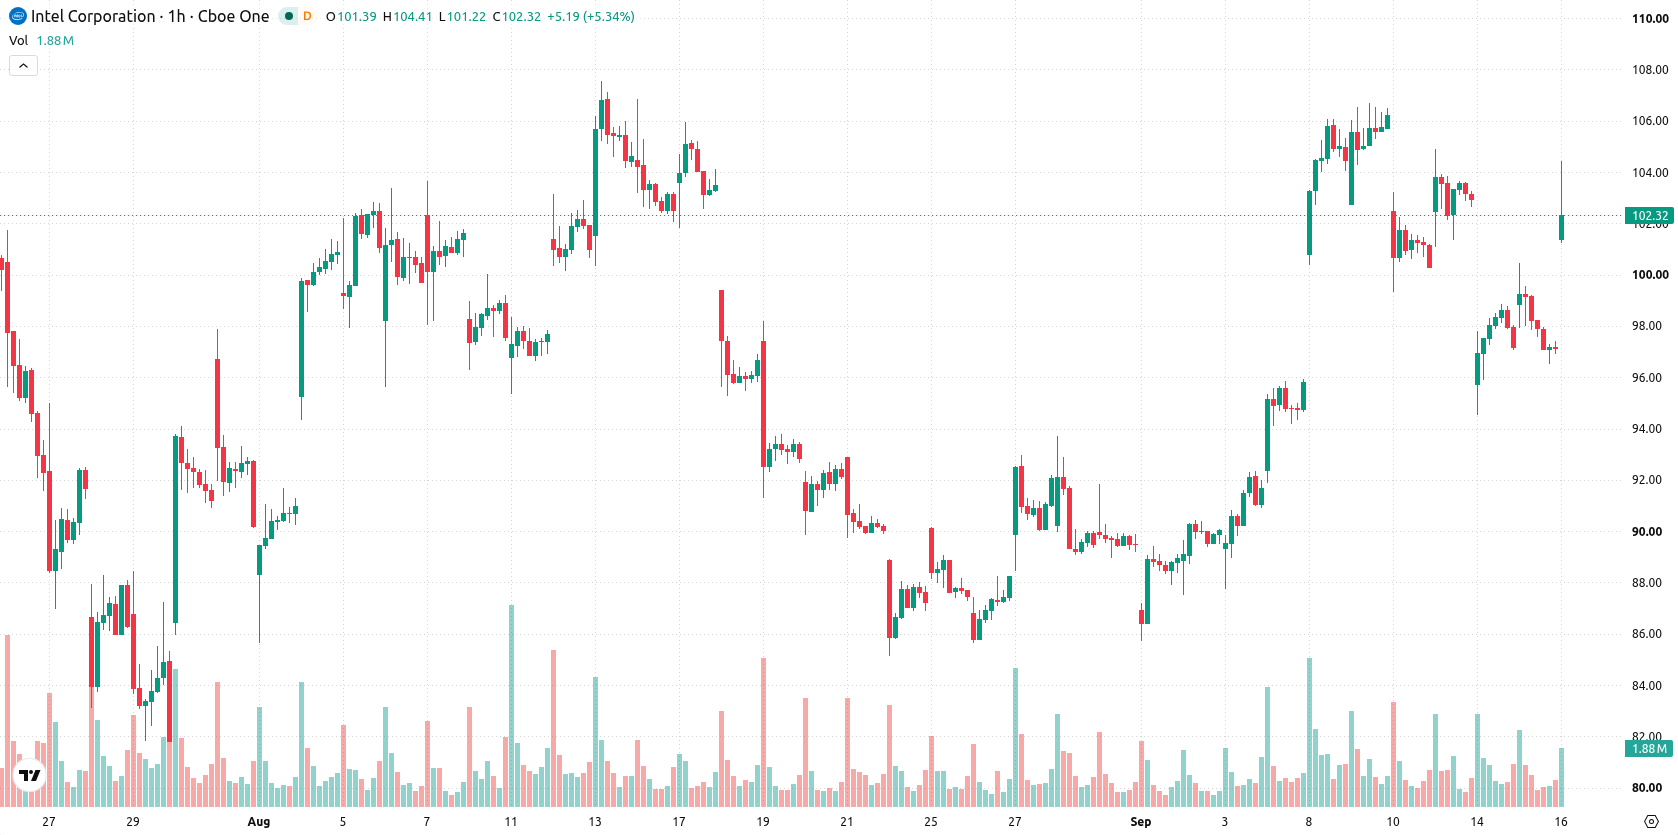
Oversold momentum and sell signals amid price strength and volatility
On the technical front, INTC is positioned above the MA-20 ($98.91) and MA-50 ($100.75) on the hourly timeframe, as well as well above the MA-200 ($76.13) on the daily chart. The Ichimoku Kijun at $99.71 serves as immediate support. Momentum indicators diverge from price action: MACD issues a Sell signal and ADX is Neutral, while RSI, CCI, and Bull/Bear Power all register oversold readings, pointing to active seller dominance intraday. Stoch RSI also indicates oversold conditions, and the Awesome Oscillator confirms downward momentum, underscoring short-term weakness even as price closes near session highs amid heightened volatility.
Range-bound outlook as upside capped by resistance and risk skewed lower
Looking ahead, the expected trading range for INTC over the next several sessions is $95.14 to $105.95. The probability model currently assigns a 32% chance to an upward breakout and a 68% likelihood of a downward swing. The base case scenario envisions stabilization within this volatility band relative to current levels, with a bullish extension triggered only if resistance at $105.95 is cleared, while a move below $95.14 would confirm renewed downside pressure.
Earlier, analysts noted that Intel’s performance was highly susceptible to market volatility and awaited further developments on strategic partnerships and macroeconomic catalysts. The current analysis builds on this by highlighting both technical divergences and fundamental advancements, suggesting traders should monitor the $95.14 to $105.95 range for signs of a bullish breakout or renewed downside risk.











-
 Afghanistan
-
 Albania
-
 Algeria
-
 Angola
-
 Argentina
-
 Armenia
-
 Australia
-
 Austria
-
 Azerbaijan
-
 Bahamas
-
 Bahrain
-
 Bangladesh
-
 Belarus
-
 Belgium
-
 Bolivia
-
 Botswana
-
 Brazil
-
 Brunei
-
 Bulgaria
-
 Cambodia
-
 Cameroon
-
 Canada
-
 Chile
-
 China
-
 Colombia
-
 Congo
-
 Costa Rica
-
 Cote d'Ivoire
-
 Croatia
-
 Cuba
-
 Cyprus
-
 Czechia
-
 DR Congo
-
 Denmark
-
 Dominican Republic
-
 Ecuador
-
 Egypt
-
 El Salvador
-
 Estonia
-
 Eswatini
-
 Ethiopia
-
 Finland
-
 France
-
 Georgia
-
 Germany
-
 Ghana
-
 Greece
-
 Haiti
-
 Hong Kong
-
 Hungary
-
 India
-
 Indonesia
-
 Iran, Islamic republic
-
 Iraq
-
 Ireland
-
 Israel
-
 Italy
-
 Jamaica
-
 Japan
-
 Jordan
-
 Kazakhstan
-
 Kenya
-
 Korea
-
 Kuwait
-
 Kyrgyzstan
-
 Laos
-
 Latvia
-
 Lebanon
-
 Lesotho
-
 Libya
-
 Lithuania
-
 Luxembourg
-
 Madagascar
-
 Malaysia
-
 Malta
-
 Mauritius
-
 Mexico
-
 Moldova
-
 Mongolia
-
 Montenegro
-
 Morocco
-
 Mozambique
-
 Myanmar
-
 Namibia
-
 Nepal
-
 Netherlands
-
 New Zealand
-
 Nigeria
-
 North Macedonia
-
 Norway
-
 Oman
-
 Pakistan
-
 Palestine
-
 Panama
-
 Papua New Guinea
-
 Paraguay
-
 Peru
-
 Philippines
-
 Poland
-
 Portugal
-
 Puerto Rico
-
 Qatar
-
 Reunion
-
 Romania
-
 Rwanda
-
 Saudi Arabia
-
 Serbia
-
 Singapore
-
 Slovakia
-
 Slovenia
-
 Somalia
-
 South Africa
-
 Spain
-
 Sri Lanka
-
 Sweden
-
 Switzerland
-
 Syria
-
 Taiwan
-
 Tajikistan
-
 Tanzania
-
 Thailand
-
 Trinidad and Tobago
-
 Tunisia
-
 Turkey
-
 UAE
-
 Uganda
-
 Ukraine
-
 United Kingdom
-
United States
-
 Uruguay
-
 Uzbekistan
-
 Venezuela
-
 Vietnam
-
 Yemen
-
 Zambia
-
 Zimbabwe
- Forex
- Crypto












