

IBM stock falls around 3.5% as bearish momentum and volatility weigh on shares

International Business Machines Corporation (IBM) fell 3.52% as selling pressure and a downside intraday gap drove a decline, with intraday momentum dominated by bearish sentiment. The drop is supported by volatility and the stock's continued position below its 200-day moving average, which points to persistent longer-term downside risk.
 258.33
Highlights
- Shares of IBM fell 3.52% to $239.62, trading near the session low with intraday volatility at 2.3%.
- Price action is diverging from momentum indicators, which show overbought conditions as buyers dominate intraday momentum.
- IBM stock is expected to trade between $229.68 and $249.56 in the next five sessions, with a 71% probability of an upward move.
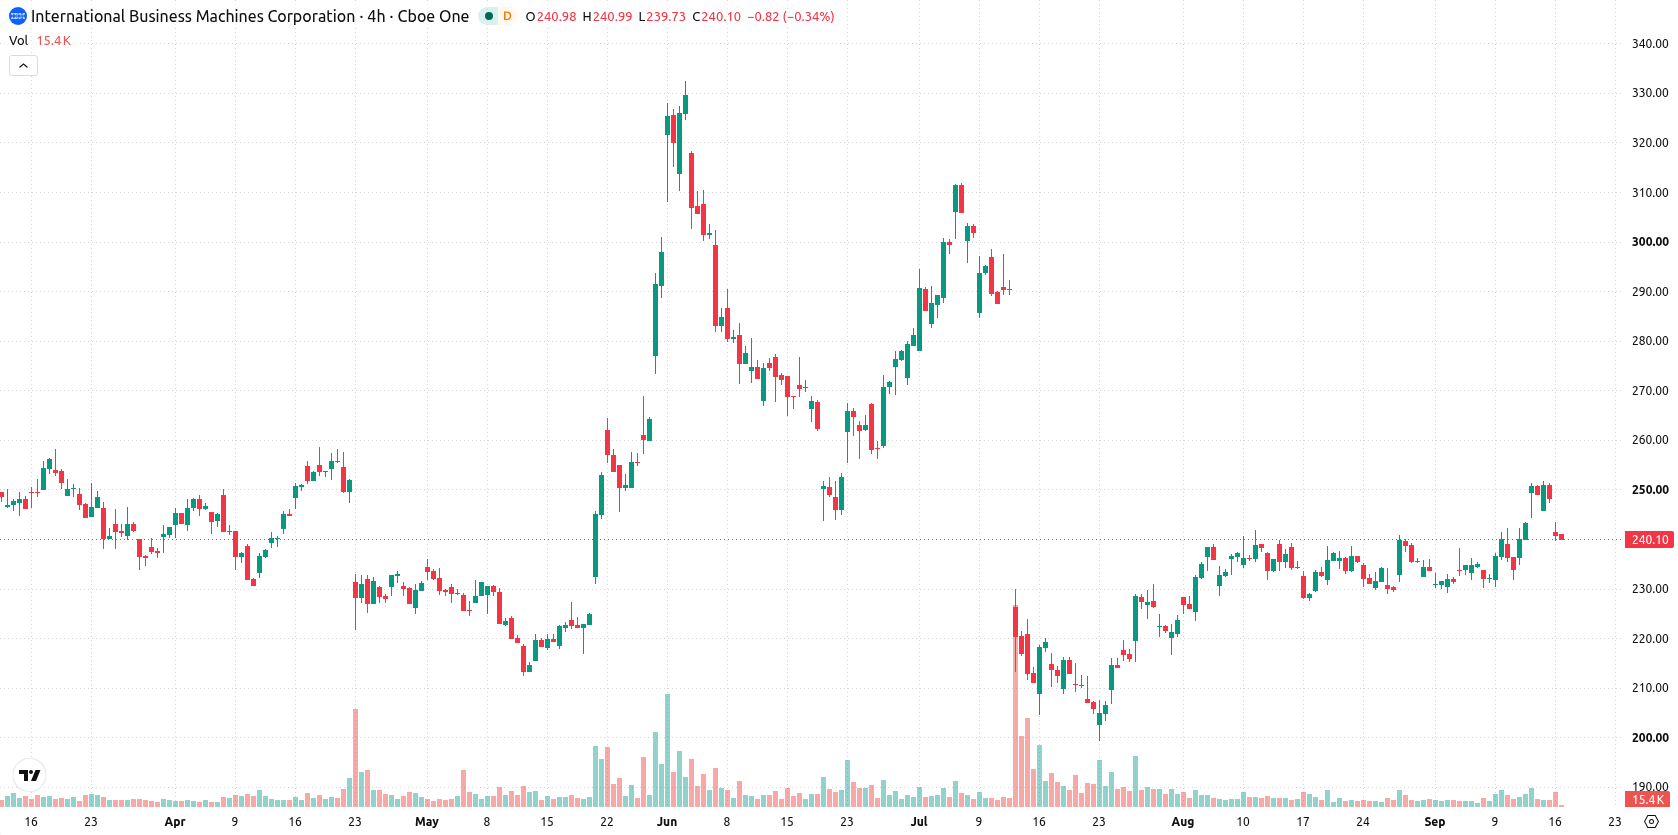
Support tested as momentum signals diverge from overbought oscillators
IBM is trading above both the MA-20 at $236.11 and the MA-50 at $236.17, indicating near-term and medium-term support. The stock remains below the MA-200 at $260.68, highlighting ongoing longer-term downside risk. Immediate support is seen at the Ichimoku Kijun at $239.61, with near-term resistance established at $246.15. Momentum signals are mixed: the MACD remains bullish at $3.48, the ADX is neutral at 10.88, and the RSI is moderately strong at 60.37 with a 'Buy' forecast. However, the Stochastic RSI, CCI, and BBP all point to overbought conditions, with BBP at 12.66 signaling buyers dominate intraday momentum. The Awesome Oscillator (AO) also shows a bullish forecast, supporting recent strength. IBM is quoted near the session low after a downside gap and exhibits 2.30% intraday volatility, showing clear dominance of selling pressure since the open. Overbought oscillators stand in contrast to the downside move, highlighting a divergence between momentum and classical overbought signals.
Earlier, analysts noted that IBM stock was positioned for consolidation amid mixed technical signals and market uncertainty. The current analysis adds further nuance by highlighting a divergence between renewed downside pressure and persistent bullish momentum readings, making the $239.61 support a critical level to watch for the next potential move.










-
 Afghanistan
-
 Albania
-
 Algeria
-
 Angola
-
 Argentina
-
 Armenia
-
 Australia
-
 Austria
-
 Azerbaijan
-
 Bahamas
-
 Bahrain
-
 Bangladesh
-
 Belarus
-
 Belgium
-
 Bolivia
-
 Botswana
-
 Brazil
-
 Brunei
-
 Bulgaria
-
 Cambodia
-
 Cameroon
-
 Canada
-
 Chile
-
 China
-
 Colombia
-
 Congo
-
 Costa Rica
-
 Cote d'Ivoire
-
 Croatia
-
 Cuba
-
 Cyprus
-
 Czechia
-
 DR Congo
-
 Denmark
-
 Dominican Republic
-
 Ecuador
-
 Egypt
-
 El Salvador
-
 Estonia
-
 Eswatini
-
 Ethiopia
-
 Finland
-
 France
-
 Georgia
-
 Germany
-
 Ghana
-
 Greece
-
 Haiti
-
 Hong Kong
-
 Hungary
-
 India
-
 Indonesia
-
 Iran, Islamic republic
-
 Iraq
-
 Ireland
-
 Israel
-
 Italy
-
 Jamaica
-
 Japan
-
 Jordan
-
 Kazakhstan
-
 Kenya
-
 Korea
-
 Kuwait
-
 Kyrgyzstan
-
 Laos
-
 Latvia
-
 Lebanon
-
 Lesotho
-
 Libya
-
 Lithuania
-
 Luxembourg
-
 Madagascar
-
 Malaysia
-
 Malta
-
 Mauritius
-
 Mexico
-
 Moldova
-
 Mongolia
-
 Montenegro
-
 Morocco
-
 Mozambique
-
 Myanmar
-
 Namibia
-
 Nepal
-
 Netherlands
-
 New Zealand
-
 Nigeria
-
 North Macedonia
-
 Norway
-
 Oman
-
 Pakistan
-
 Palestine
-
 Panama
-
 Papua New Guinea
-
 Paraguay
-
 Peru
-
 Philippines
-
 Poland
-
 Portugal
-
 Puerto Rico
-
 Qatar
-
 Reunion
-
 Romania
-
 Rwanda
-
 Saudi Arabia
-
 Serbia
-
 Singapore
-
 Slovakia
-
 Slovenia
-
 Somalia
-
 South Africa
-
 Spain
-
 Sri Lanka
-
 Sweden
-
 Switzerland
-
 Syria
-
 Taiwan
-
 Tajikistan
-
 Tanzania
-
 Thailand
-
 Trinidad and Tobago
-
 Tunisia
-
 Turkey
-
 UAE
-
 Uganda
-
 Ukraine
-
 United Kingdom
-
United States
-
 Uruguay
-
 Uzbekistan
-
 Venezuela
-
 Vietnam
-
 Yemen
-
 Zambia
-
 Zimbabwe
- Forex
- Crypto












