

Rising US national debt weighs on Agnico Eagle Mines stock near C$278.6 resistance

Agnico Eagle Mines (AEM) stock is trading at C$274.59, showing a modest advance in the latest session. The price remains below its major moving averages in the short and medium term, but stays above long-term averages, highlighting a mixed technical setup.
 237.81
256.51
Highlights
- Large investors have increased capital flows into shares of Agnico Eagle Mines as a low-cost gold producer during a period of rising US debt.
- No recent operational changes have been reported for Agnico Eagle Mines, with institutional inflows being the main factor influencing the stock.
- Shares of Agnico Eagle Mines trade below key short- and medium-term averages but remain above long-term support, with a projected range of C$266.44 to C$282.74 and a higher probability for a downside move.
Institutional inflows rise as debt concerns drive demand for gold assets
Agnico Eagle Mines has attracted increased attention from large investors as a low-cost gold producer in the context of rising US national debt, according to Simplywall. This shift in institutional interest indicates that Agnico Eagle Mines' position within the gold industry may be drawing capital flows from investors seeking defensive assets. While no recent operational developments have been reported, the inflow of attention from institutional buyers remains the main factor shaping sentiment around the stock.
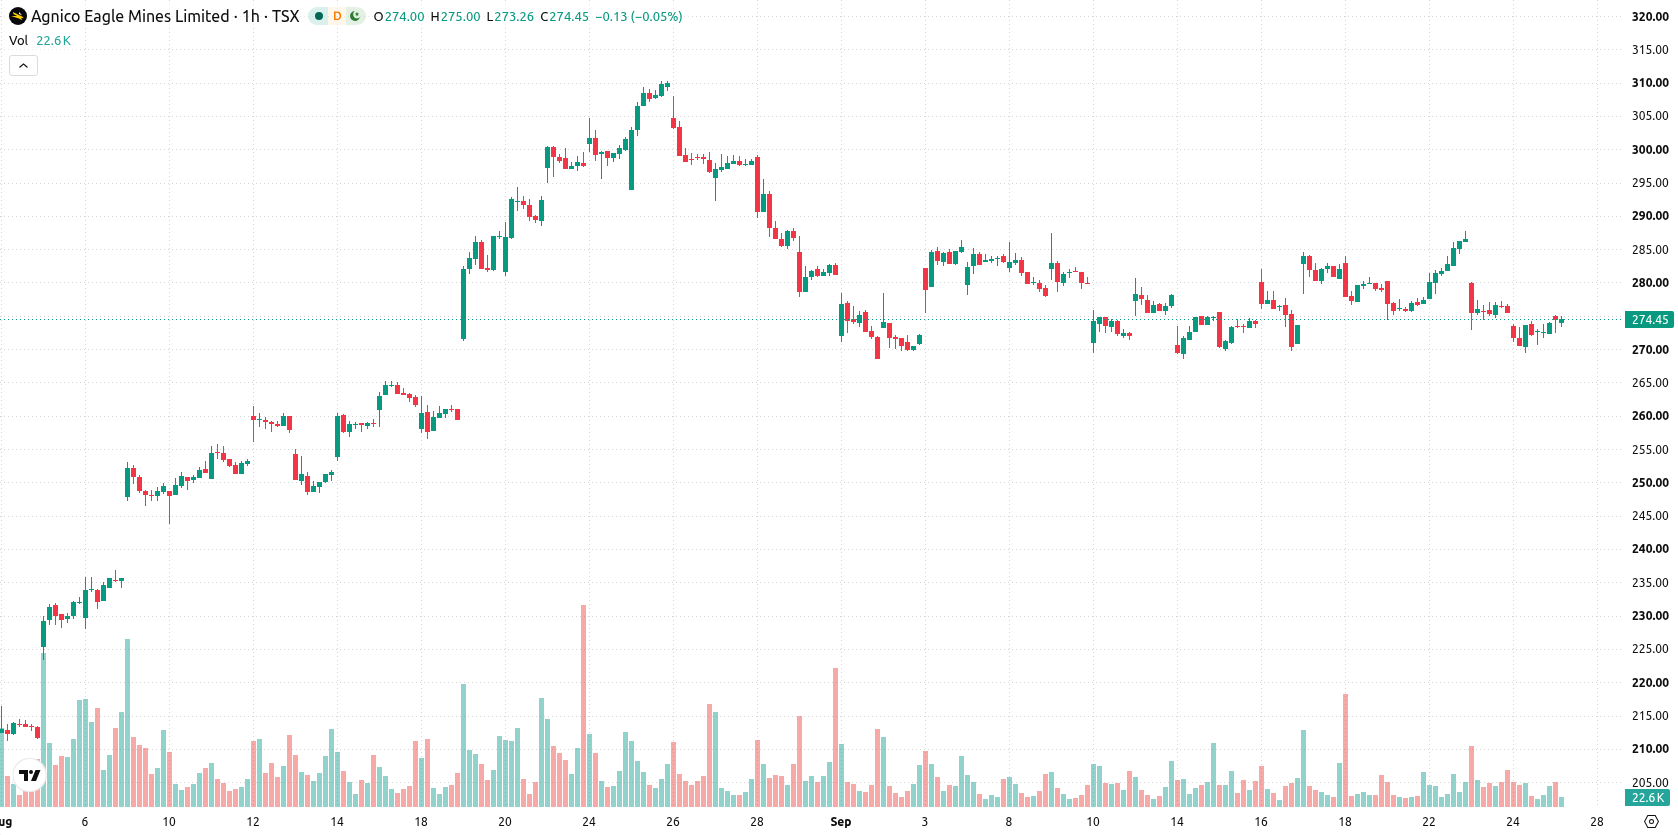
Resistance firms and momentum diverges amid conflicting oscillator signals
On the hourly chart, AEM/CAD is trading below the MA-20 at C$276.98 and the MA-50 at C$277.65, signaling short- and medium-term technical pressure, while holding above the MA-200 at C$260.99. The Ichimoku Kijun at C$278.6 establishes immediate resistance; price remains supported above its longer-term average. Among oscillators, MACD prints a Sell, ADX is Neutral, RSI reads 44.28, CCI is on Sell, and Bull/Bear Power indicates an Oversold condition, though Stoch RSI is Overbought. Price action is characterized by a small bullish gap (-0.37) and moderate volatility, as mixed indicator readings reflect tension between transient upward moves and prevailing seller momentum.
Rangebound outlook persists as downside risk outweighs breakout
Over the next several days, price is expected to remain rangebound between C$266.44 support and C$282.74 resistance, illustrating a typical volatility band relative to current levels. The likelihood of a downward move is higher, at 57%, with an upward breakout probability of 43%. If AEM/CAD breaks above C$278.6, a bullish scenario is triggered; conversely, a fall below C$266.44 signals renewed selling pressure and continuation of the prevailing downtrend.
Earlier, analysts noted that despite robust capital returns, Agnico Eagle Mines continued to face sustained technical pressure with downside risks prevailing. The current analysis adds a new dimension by highlighting increased institutional interest amid macroeconomic factors, making the C$278.6 resistance level a key barrier that could signal a shift in trend if decisively breached.






Latest Agnico Eagle News





-
 Afghanistan
-
 Albania
-
 Algeria
-
 Angola
-
 Argentina
-
 Armenia
-
 Australia
-
 Austria
-
 Azerbaijan
-
 Bahamas
-
 Bahrain
-
 Bangladesh
-
 Belarus
-
 Belgium
-
 Bolivia
-
 Botswana
-
 Brazil
-
 Brunei
-
 Bulgaria
-
 Cambodia
-
 Cameroon
-
 Canada
-
 Chile
-
 China
-
 Colombia
-
 Congo
-
 Costa Rica
-
 Cote d'Ivoire
-
 Croatia
-
 Cuba
-
 Cyprus
-
 Czechia
-
 DR Congo
-
 Denmark
-
 Dominican Republic
-
 Ecuador
-
 Egypt
-
 El Salvador
-
 Estonia
-
 Eswatini
-
 Ethiopia
-
 Finland
-
 France
-
 Georgia
-
 Germany
-
 Ghana
-
 Greece
-
 Haiti
-
 Hong Kong
-
 Hungary
-
 India
-
 Indonesia
-
 Iran, Islamic republic
-
 Iraq
-
 Ireland
-
 Israel
-
 Italy
-
 Jamaica
-
 Japan
-
 Jordan
-
 Kazakhstan
-
 Kenya
-
 Korea
-
 Kuwait
-
 Kyrgyzstan
-
 Laos
-
 Latvia
-
 Lebanon
-
 Lesotho
-
 Libya
-
 Lithuania
-
 Luxembourg
-
 Madagascar
-
 Malaysia
-
 Malta
-
 Mauritius
-
 Mexico
-
 Moldova
-
 Mongolia
-
 Montenegro
-
 Morocco
-
 Mozambique
-
 Myanmar
-
 Namibia
-
 Nepal
-
 Netherlands
-
 New Zealand
-
 Nigeria
-
 North Macedonia
-
 Norway
-
 Oman
-
 Pakistan
-
 Palestine
-
 Panama
-
 Papua New Guinea
-
 Paraguay
-
 Peru
-
 Philippines
-
 Poland
-
 Portugal
-
 Puerto Rico
-
 Qatar
-
 Reunion
-
 Romania
-
 Rwanda
-
 Saudi Arabia
-
 Serbia
-
 Singapore
-
 Slovakia
-
 Slovenia
-
 Somalia
-
 South Africa
-
 Spain
-
 Sri Lanka
-
 Sweden
-
 Switzerland
-
 Syria
-
 Taiwan
-
 Tajikistan
-
 Tanzania
-
 Thailand
-
 Trinidad and Tobago
-
 Tunisia
-
 Turkey
-
 UAE
-
 Uganda
-
 Ukraine
-
 United Kingdom
-
United States
-
 Uruguay
-
 Uzbekistan
-
 Venezuela
-
 Vietnam
-
 Yemen
-
 Zambia
-
 Zimbabwe
- Forex
- Crypto












