

Can SoFi stock hold $15.27 support as seller pressure builds?

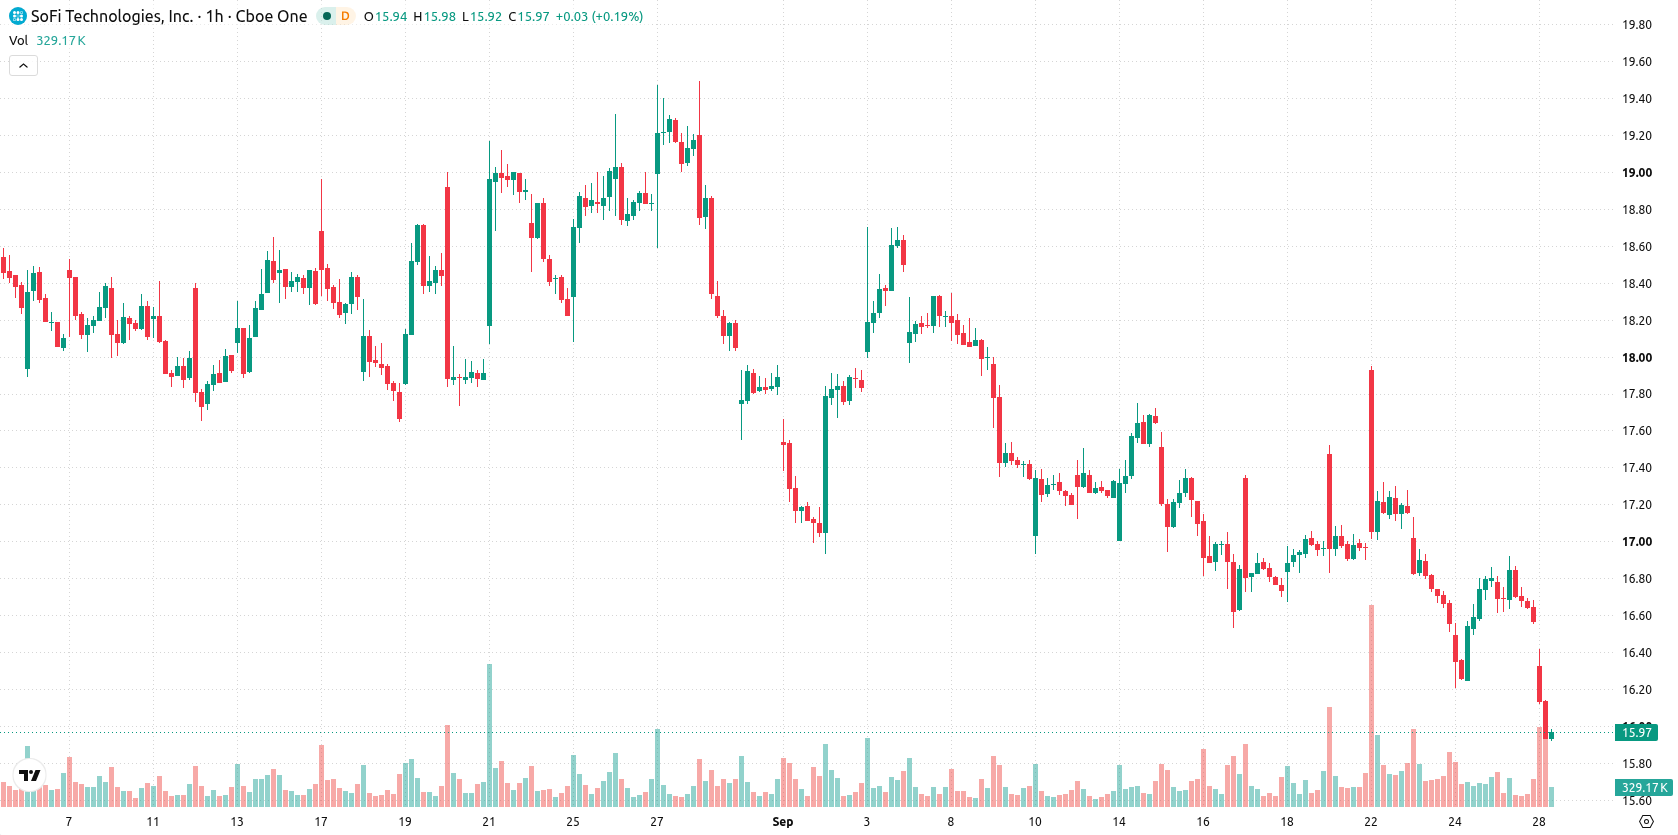
SoFi (SOFI) stock is trading at $16.03, recording a daily decline of 3.23%. The price is currently positioned below its key moving averages, reflecting short-term weakness against typical trend-following benchmarks.
 17.60
17.63
Highlights
- SoFi Technologies and Mastercard enabled SoFiUSD settlement on Mastercard's global payment network, expanding SoFi Bank's card transaction capabilities with a new U.S. dollar-pegged, cash-backed transaction layer.
- This development broadens the payments infrastructure for SoFi's debit and credit card products, increasing utility and reach for users.
- Shares of SoFi trade under persistent bearish pressure with technical indicators negative and a forecast range of $15.27 to $16.79, with further declines much more likely than a rebound.
Payment network expansion as price lags on persistent selling
On September 22, 2026, SoFi Technologies and Mastercard launched SoFiUSD settlement on Mastercard’s global payment network for SoFi Bank’s debit and credit card transactions, as reported by Kucoin. This development increases the utility and reach of SoFi’s card offerings, providing a new transaction layer pegged 1:1 to the U.S. dollar and fully backed by cash reserves. While the move expands SoFi’s payments infrastructure and could enhance transactional flows in the long run, price action has remained under broader selling pressure.
Downtrend persists as moving averages and MACD reinforce seller bias
On the technical front, SOFI is trading below the MA-20 and MA-50 on the hourly timeframe, and also remains beneath the MA-200 on the daily chart. The Ichimoku Kijun currently stands at $16.75, defining immediate resistance. Momentum indicators provide mixed signals: MACD signals a strong sell, while ADX, Stochastic RSI, CCI, and Awesome Oscillator remain neutral; RSI is at 42.21, indicating mild sell pressure without oversold conditions. Bull/Bear Power points to continued seller dominance in the present session.
Further downside risk heightened as critical support nears
In the short term, SOFI is expected to trade within a volatility band of $15.27 to $16.79 over the next 2–3 sessions. The probability of a further decline remains very high, with limited prospects for a near-term rebound. If support at $15.27 is breached, the downward trend is likely to accelerate, whereas a move above $16.75 could indicate a corrective, but likely brief, upward retracement.
Earlier, analysts noted that wider fintech adoption and the automation of cash management could amplify pressure on traditional banks as consumers seek higher yields via platforms like SoFi. The current technical landscape reinforces downside risk, and traders should closely monitor the $15.27 level as a decisive threshold for further weakness.










-
 Afghanistan
-
 Albania
-
 Algeria
-
 Angola
-
 Argentina
-
 Armenia
-
 Australia
-
 Austria
-
 Azerbaijan
-
 Bahamas
-
 Bahrain
-
 Bangladesh
-
 Belarus
-
 Belgium
-
 Bolivia
-
 Botswana
-
 Brazil
-
 Brunei
-
 Bulgaria
-
 Cambodia
-
 Cameroon
-
 Canada
-
 Chile
-
 China
-
 Colombia
-
 Congo
-
 Costa Rica
-
 Cote d'Ivoire
-
 Croatia
-
 Cuba
-
 Cyprus
-
 Czechia
-
 DR Congo
-
 Denmark
-
 Dominican Republic
-
 Ecuador
-
 Egypt
-
 El Salvador
-
 Estonia
-
 Eswatini
-
 Ethiopia
-
 Finland
-
 France
-
 Georgia
-
 Germany
-
 Ghana
-
 Greece
-
 Haiti
-
 Hong Kong
-
 Hungary
-
 India
-
 Indonesia
-
 Iran, Islamic republic
-
 Iraq
-
 Ireland
-
 Israel
-
 Italy
-
 Jamaica
-
 Japan
-
 Jordan
-
 Kazakhstan
-
 Kenya
-
 Korea
-
 Kuwait
-
 Kyrgyzstan
-
 Laos
-
 Latvia
-
 Lebanon
-
 Lesotho
-
 Libya
-
 Lithuania
-
 Luxembourg
-
 Madagascar
-
 Malaysia
-
 Malta
-
 Mauritius
-
 Mexico
-
 Moldova
-
 Mongolia
-
 Montenegro
-
 Morocco
-
 Mozambique
-
 Myanmar
-
 Namibia
-
 Nepal
-
 Netherlands
-
 New Zealand
-
 Nigeria
-
 North Macedonia
-
 Norway
-
 Oman
-
 Pakistan
-
 Palestine
-
 Panama
-
 Papua New Guinea
-
 Paraguay
-
 Peru
-
 Philippines
-
 Poland
-
 Portugal
-
 Puerto Rico
-
 Qatar
-
 Reunion
-
 Romania
-
 Rwanda
-
 Saudi Arabia
-
 Serbia
-
 Singapore
-
 Slovakia
-
 Slovenia
-
 Somalia
-
 South Africa
-
 Spain
-
 Sri Lanka
-
 Sweden
-
 Switzerland
-
 Syria
-
 Taiwan
-
 Tajikistan
-
 Tanzania
-
 Thailand
-
 Trinidad and Tobago
-
 Tunisia
-
 Turkey
-
 UAE
-
 Uganda
-
 Ukraine
-
 United Kingdom
-
United States
-
 Uruguay
-
 Uzbekistan
-
 Venezuela
-
 Vietnam
-
 Yemen
-
 Zambia
-
 Zimbabwe
- Forex
- Crypto












