

Ofcom blocks broadband discounts: BT-A technical outlook

BT Group (BT-A) stock is trading at GBX195.40 after a modest decline today, moving lower but remaining above its intermediate moving average levels. The share price currently sits in a narrow intraday range, positioned between short-term and long-term trend supports.
 194.80
200.10
194.80
200.10
Highlights
- Ofcom has barred BT Group from offering broadband discounts to rivals, imposing restrictions on its pricing strategy to address market competition concerns.
- The regulatory move limits BT Group's ability to gain customers quickly through aggressive pricing and may influence the future structure of the UK broadband market.
- Shares of BT Group face intraday bearish pressure, with weak momentum signals and a 70% probability of trading between GBX189.65 and GBX201.15 in the next 2 to 3 days.
Competition strategy shifts as Ofcom blocks BT Group's broadband discounts
BT Group has faced a recent setback after Ofcom blocked the company from offering broadband discounts, citing concerns that such cut-price network access for rivals could impede the market growth of alternative networks. This move restricts BT's ability to use aggressive pricing as a tool for rapid customer acquisition, potentially preserving a more level playing field among broadband providers. The regulatory decision introduces new constraints on BT's competition strategy and may shape the near-term development of the UK broadband market.
MACD momentum diverges from weak oscillators amid layered technical support
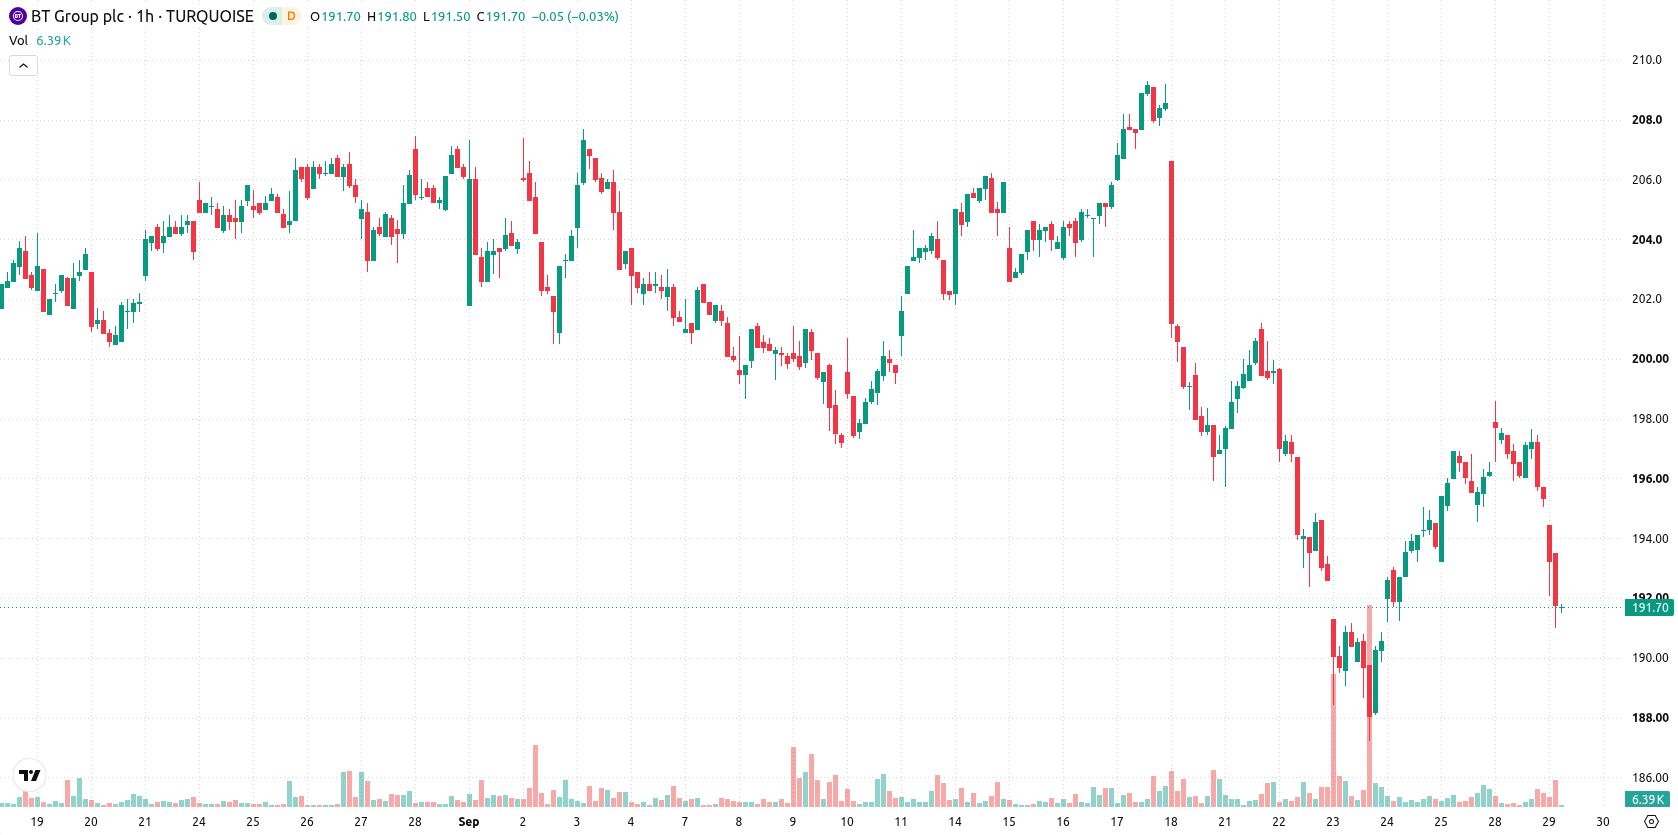
On the H1 timeframe, BT-A is trading below the MA-20 and MA-200, while holding above the MA-50, highlighting short-term and long-term downward pressure alongside intermediate support. The Ichimoku Kijun level at GBX195.05 acts as immediate support. Among momentum signals, MACD shows a strong buy reading, whereas ADX is neutral, indicating limited trend strength. Oscillators show contraction: RSI at 48.26 indicates a sell signal, Stoch RSI is oversold, and CCI also points to a sell setup, while Bull/Bear Power remains oversold, reflecting ongoing seller control within intraday action. This creates a technical divergence, with strong MACD momentum but overall weak oscillator signals.
Downside risk dominates on low breakout probability within volatility range
Over the next 2 to 3 trading days, the price is expected to fluctuate within a typical volatility band between GBX189.65 and GBX201.15. There is a 30% probability of an upward move and a 70% probability of further declines, making sideways action within this range the baseline view. A sustained recovery will require a convincing break above current resistance, while a move below immediate support could add to downward momentum.
Earlier, analysts noted that BT Group faced ongoing downside risks following regulatory setbacks and technical weakness. The latest developments reinforce this cautious outlook, with traders advised to monitor for a break below immediate support as a trigger for renewed downward momentum.









-
 Afghanistan
-
 Albania
-
 Algeria
-
 Angola
-
 Argentina
-
 Armenia
-
 Australia
-
 Austria
-
 Azerbaijan
-
 Bahamas
-
 Bahrain
-
 Bangladesh
-
 Belarus
-
 Belgium
-
 Bolivia
-
 Botswana
-
 Brazil
-
 Brunei
-
 Bulgaria
-
 Cambodia
-
 Cameroon
-
 Canada
-
 Chile
Chile
-
 China
China
-
 Colombia
-
 Congo
Congo
-
 Costa Rica
-
 Cote d'Ivoire
-
 Croatia
-
 Cuba
Cuba
-
 Cyprus
-
 Czechia
-
 DR Congo
-
 Denmark
-
 Dominican Republic
-
 Ecuador
-
 Egypt
Egypt
-
 El Salvador
-
 Estonia
-
 Eswatini
-
 Ethiopia
-
 Finland
-
 France
-
 Georgia
-
 Germany
-
 Ghana
Ghana
-
 Greece
-
 Haiti
Haiti
-
 Hong Kong
-
 Hungary
-
 India
India
-
 Indonesia
-
 Iran, Islamic republic
-
 Iraq
Iraq
-
 Ireland
-
 Israel
-
 Italy
Italy
-
 Jamaica
-
 Japan
Japan
-
 Jordan
-
 Kazakhstan
-
 Kenya
Kenya
-
 Korea
Korea
-
 Kuwait
-
 Kyrgyzstan
-
 Laos
Laos
-
 Latvia
-
 Lebanon
-
 Lesotho
-
 Libya
Libya
-
 Lithuania
-
 Luxembourg
-
 Madagascar
-
 Malaysia
-
 Malta
Malta
-
 Mauritius
-
 Mexico
-
 Moldova
-
 Mongolia
-
 Montenegro
-
 Morocco
-
 Mozambique
-
 Myanmar
-
 Namibia
-
 Nepal
Nepal
-
 Netherlands
-
 New Zealand
-
 Nigeria
-
 North Macedonia
-
 Norway
-
 Oman
Oman
-
 Pakistan
-
 Palestine
-
 Panama
-
 Papua New Guinea
-
 Paraguay
-
 Peru
Peru
-
 Philippines
-
 Poland
-
 Portugal
-
 Puerto Rico
-
 Qatar
Qatar
-
 Reunion
-
 Romania
-
 Rwanda
-
 Saudi Arabia
-
 Serbia
-
 Singapore
-
 Slovakia
-
 Slovenia
-
 Somalia
-
 South Africa
-
 Spain
Spain
-
 Sri Lanka
-
 Sweden
-
 Switzerland
-
 Syria
Syria
-
 Taiwan
-
 Tajikistan
-
 Tanzania
-
 Thailand
-
 Trinidad and Tobago
-
 Tunisia
-
 Turkey
-
 UAE
UAE
-
 Uganda
-
 Ukraine
-
 United Kingdom
-
United States
-
 Uruguay
-
 Uzbekistan
-
 Venezuela
-
 Vietnam
-
 Yemen
Yemen
-
 Zambia
-
 Zimbabwe
- Forex
- Crypto












