

Quantum Computing stock support test: Technical outlook

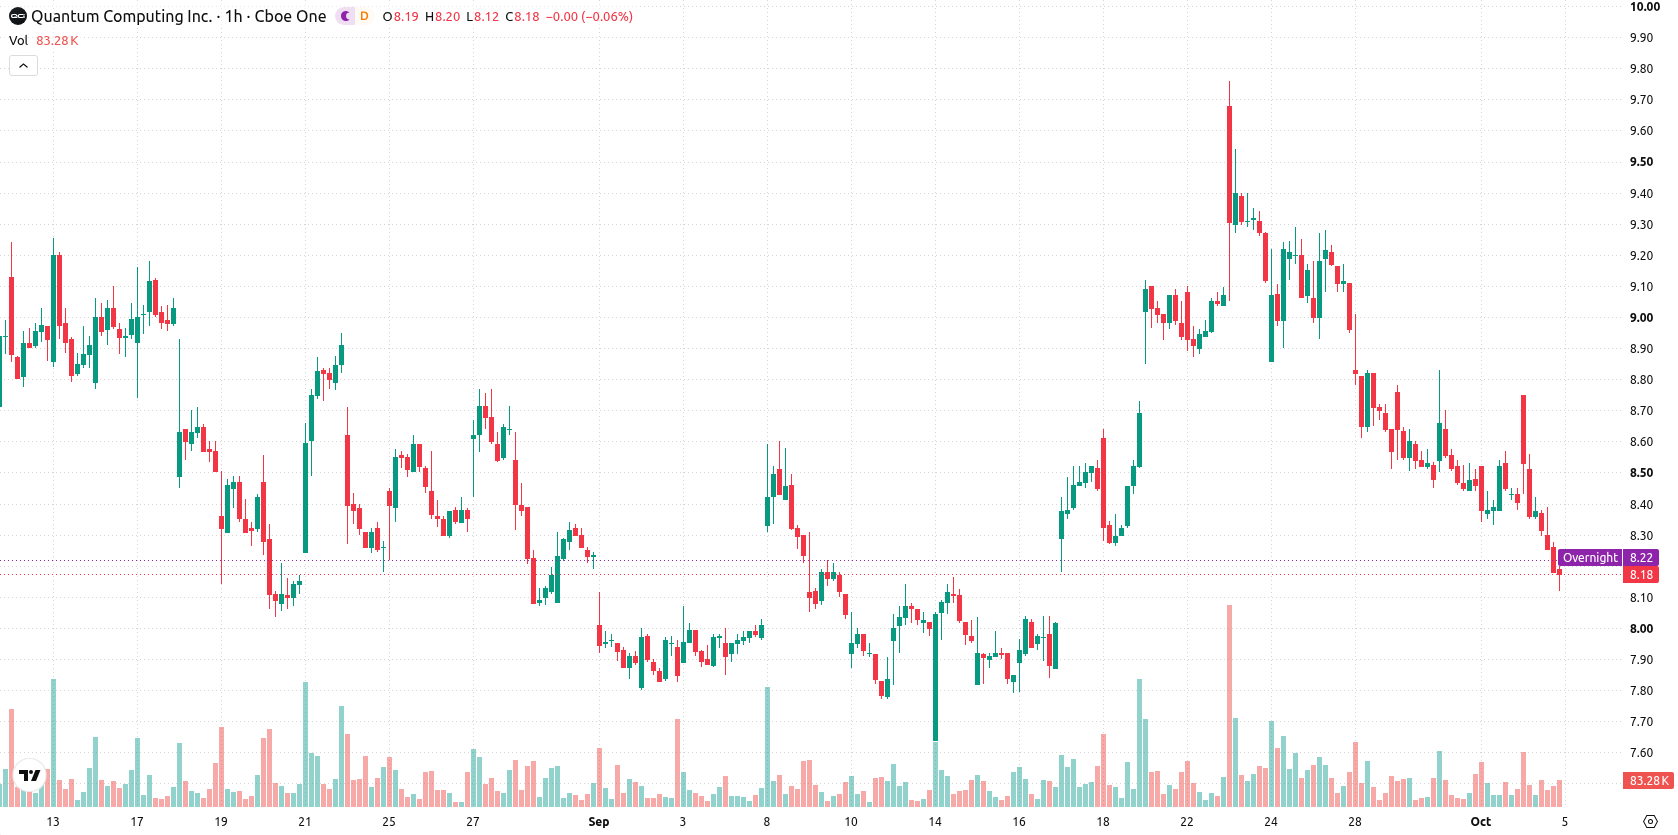
Quantum Computing (QUBT) stock is trading at $8.18 after falling 2.62% on the day. The price currently sits below its key moving averages, reflecting continued downward momentum in the near term.
 6.43
6.66
Highlights
- QUBT/USD trades below key moving averages, indicating ongoing downward momentum across multiple time frames.
- Technical indicators show strong sell momentum, with MACD bearish and several oscillators in oversold conditions.
- The price is expected to consolidate between $7.78 and $8.58, with a much higher probability of a move lower.
Oversold momentum and resistance cap recovery prospects
QUBT has closed below the MA-20 ($8.40), MA-50 ($8.69), and MA-200 ($9.18) levels, with the Ichimoku Kijun at $8.48 acting as immediate resistance. Momentum indicators reflect prevailing weakness: MACD shows ongoing sell momentum, while ADX is neutral. Both the RSI and Stoch RSI, alongside CCI, indicate oversold conditions, and Bull/Bear Power points to seller dominance. The Awesome Oscillator further confirms pressure to the downside, with the price closing near daily lows amid heightened volatility.
Tight consolidation likely as volatility limits upside
In the short term, QUBT is expected to fluctuate between $7.78 and $8.58, consistent with current patterns of volatility. Upside potential remains limited, while the probability of further downside is high. The most likely scenario is price consolidation within this band, though a breakout above $8.48 could initiate a recovery, and a breakdown below $7.78 may accelerate losses.
Earlier, analysts noted that Quantum Computing stock was exhibiting persistent selling pressure and a prevailing bearish outlook. The current analysis strengthens this view, highlighting ongoing downside momentum and suggesting that traders monitor the $8.48 resistance level for any potential shift in trend direction.






Latest Quantum Computing News





-
 Afghanistan
-
 Albania
-
 Algeria
-
 Angola
-
 Argentina
-
 Armenia
-
 Australia
-
 Austria
-
 Azerbaijan
-
 Bahamas
-
 Bahrain
-
 Bangladesh
-
 Belarus
-
 Belgium
-
 Bolivia
-
 Botswana
-
 Brazil
-
 Brunei
-
 Bulgaria
-
 Cambodia
-
 Cameroon
-
 Canada
-
 Chile
-
 China
-
 Colombia
-
 Congo
-
 Costa Rica
-
 Cote d'Ivoire
-
 Croatia
-
 Cuba
-
 Cyprus
-
 Czechia
-
 DR Congo
-
 Denmark
-
 Dominican Republic
-
 Ecuador
-
 Egypt
-
 El Salvador
-
 Estonia
-
 Eswatini
-
 Ethiopia
-
 Finland
-
 France
-
 Georgia
-
 Germany
-
 Ghana
-
 Greece
-
 Haiti
-
 Hong Kong
-
 Hungary
-
 India
-
 Indonesia
-
 Iran, Islamic republic
-
 Iraq
-
 Ireland
-
 Israel
-
 Italy
-
 Jamaica
-
 Japan
-
 Jordan
-
 Kazakhstan
-
 Kenya
-
 Korea
-
 Kuwait
-
 Kyrgyzstan
-
 Laos
-
 Latvia
-
 Lebanon
-
 Lesotho
-
 Libya
-
 Lithuania
-
 Luxembourg
-
 Madagascar
-
 Malaysia
-
 Malta
-
 Mauritius
-
 Mexico
-
 Moldova
-
 Mongolia
-
 Montenegro
-
 Morocco
-
 Mozambique
-
 Myanmar
-
 Namibia
-
 Nepal
-
 Netherlands
-
 New Zealand
-
 Nigeria
-
 North Macedonia
-
 Norway
-
 Oman
-
 Pakistan
-
 Palestine
-
 Panama
-
 Papua New Guinea
-
 Paraguay
-
 Peru
-
 Philippines
-
 Poland
-
 Portugal
-
 Puerto Rico
-
 Qatar
-
 Reunion
-
 Romania
-
 Rwanda
-
 Saudi Arabia
-
 Serbia
-
 Singapore
-
 Slovakia
-
 Slovenia
-
 Somalia
-
 South Africa
-
 Spain
-
 Sri Lanka
-
 Sweden
-
 Switzerland
-
 Syria
-
 Taiwan
-
 Tajikistan
-
 Tanzania
-
 Thailand
-
 Trinidad and Tobago
-
 Tunisia
-
 Turkey
-
 UAE
-
 Uganda
-
 Ukraine
-
 United Kingdom
-
United States
-
 Uruguay
-
 Uzbekistan
-
 Venezuela
-
 Vietnam
-
 Yemen
-
 Zambia
-
 Zimbabwe
- Forex
- Crypto












