

NuCana shares technical analysis: Support test at $0.89 in focus

NuCana (NCNA) stock is trading at $1.06 after a daily decline of 4.86%. The price remains below its key moving averages, indicating a clear short-term and long-term downside bias.
 1.14
1.19
1.14
1.19
Highlights
- NCNA/USD trades below key moving averages with seller pressure dominating across short, medium, and long-term timeframes.
- Momentum indicators confirm a strong sell bias and oversold conditions, though Stoch RSI suggests potential for a short-term bounce.
- Expected price range for the next few days is $0.89 to $1.23, with a much higher probability of further decline than recovery.
Persistent selling pressure as oscillators indicate oversold and volatility rises
On the hourly chart, NCNA is trading below the MA-20 ($1.20) and MA-50 ($1.25), and it remains well beneath the daily MA-200 at $2. The Ichimoku Kijun level at $1.22 serves as immediate resistance. Momentum signals are broadly negative: MACD and ADX indicate continued selling pressure, while RSI stands low at 34.78 (Sell) and CCI reflects oversold conditions. Notably, Stoch RSI flashes a strong buy, aligning with the oversold readings and suggesting a possible short-term bounce. Bull/Bear Power confirms strong seller dominance, while the Awesome Oscillator is neutral. Despite some oscillator divergence, with oversold signals contrasting with persistent seller control, intraday price action tracked sharply lower to close near session lows amid high volatility.
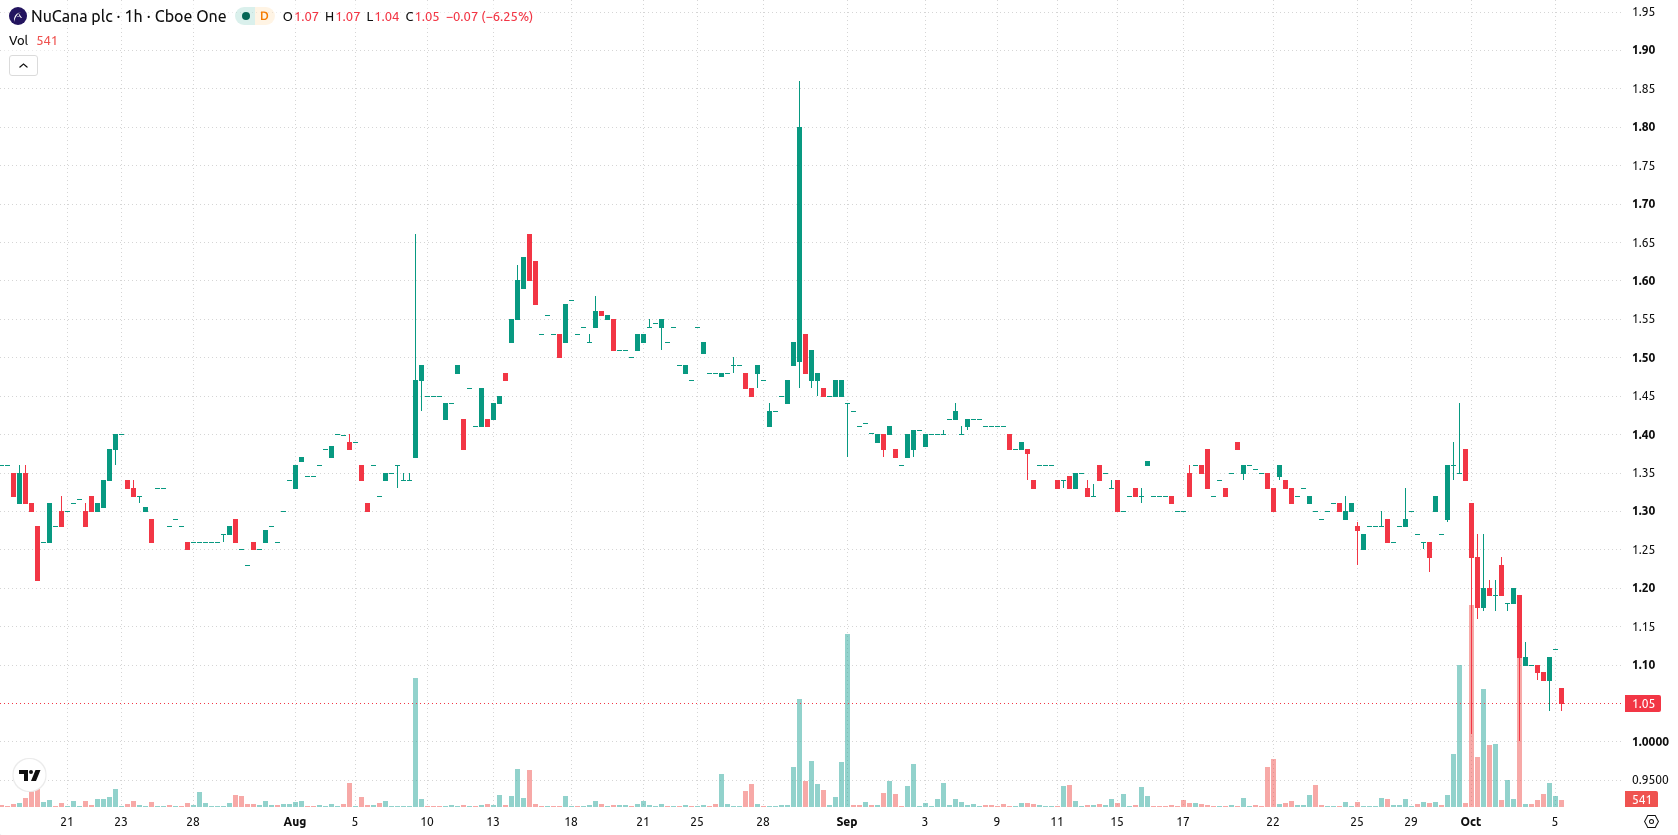
Further declines likely as price volatility persists within range
Over the next few days, price action is expected to remain volatile within the $0.89–$1.23 band, reflecting the current volatility range. The probability of another move lower is high, and further weakness is more likely than a sustained recovery. Should NCNA break above immediate resistance at $1.22, a reversal attempt could take shape, while a drop below $0.89 would expose new lows and maintain the prevailing downward trend.
Earlier, analysts noted that NuCana’s persistent weakness was underscored by prevailing downside momentum and sellers retaining control. The current analysis strengthens this view, with fresh technical signals highlighting the importance of $1.22 as a crucial resistance level and pointing to heightened downside risk if support at $0.89 fails.










-
 Afghanistan
-
 Albania
-
 Algeria
-
 Angola
-
 Argentina
-
 Armenia
-
 Australia
-
 Austria
-
 Azerbaijan
-
 Bahamas
-
 Bahrain
-
 Bangladesh
-
 Belarus
-
 Belgium
-
 Bolivia
-
 Botswana
-
 Brazil
-
 Brunei
-
 Bulgaria
-
 Cambodia
-
 Cameroon
-
 Canada
-
 Chile
Chile
-
 China
China
-
 Colombia
-
 Congo
Congo
-
 Costa Rica
-
 Cote d'Ivoire
-
 Croatia
-
 Cuba
Cuba
-
 Cyprus
-
 Czechia
-
 DR Congo
-
 Denmark
-
 Dominican Republic
-
 Ecuador
-
 Egypt
Egypt
-
 El Salvador
-
 Estonia
-
 Eswatini
-
 Ethiopia
-
 Finland
-
 France
-
 Georgia
-
 Germany
-
 Ghana
Ghana
-
 Greece
-
 Haiti
Haiti
-
 Hong Kong
-
 Hungary
-
 India
India
-
 Indonesia
-
 Iran, Islamic republic
-
 Iraq
Iraq
-
 Ireland
-
 Israel
-
 Italy
Italy
-
 Jamaica
-
 Japan
Japan
-
 Jordan
-
 Kazakhstan
-
 Kenya
Kenya
-
 Korea
Korea
-
 Kuwait
-
 Kyrgyzstan
-
 Laos
Laos
-
 Latvia
-
 Lebanon
-
 Lesotho
-
 Libya
Libya
-
 Lithuania
-
 Luxembourg
-
 Madagascar
-
 Malaysia
-
 Malta
Malta
-
 Mauritius
-
 Mexico
-
 Moldova
-
 Mongolia
-
 Montenegro
-
 Morocco
-
 Mozambique
-
 Myanmar
-
 Namibia
-
 Nepal
Nepal
-
 Netherlands
-
 New Zealand
-
 Nigeria
-
 North Macedonia
-
 Norway
-
 Oman
Oman
-
 Pakistan
-
 Palestine
-
 Panama
-
 Papua New Guinea
-
 Paraguay
-
 Peru
Peru
-
 Philippines
-
 Poland
-
 Portugal
-
 Puerto Rico
-
 Qatar
Qatar
-
 Reunion
-
 Romania
-
 Rwanda
-
 Saudi Arabia
-
 Serbia
-
 Singapore
-
 Slovakia
-
 Slovenia
-
 Somalia
-
 South Africa
-
 Spain
Spain
-
 Sri Lanka
-
 Sweden
-
 Switzerland
-
 Syria
Syria
-
 Taiwan
-
 Tajikistan
-
 Tanzania
-
 Thailand
-
 Trinidad and Tobago
-
 Tunisia
-
 Turkey
-
 UAE
UAE
-
 Uganda
-
 Ukraine
-
 United Kingdom
-
United States
-
 Uruguay
-
 Uzbekistan
-
 Venezuela
-
 Vietnam
-
 Yemen
Yemen
-
 Zambia
-
 Zimbabwe
- Forex
- Crypto












