

Quantum Computing stock falls nearly 3% as technical selling pressure dominates

Quantum Computing Inc. (QUBT) dropped 2.99% as persistent technical selling pressure remains the main driver, with momentum and breadth indicators skewed heavily to the downside. This decline is supported by the stock trading below all major moving averages and continued weakness signaled by trend and oscillator readings.
 6.43
6.66
Highlights
- Quantum Computing stock trades below all major moving averages, confirming persistent seller dominance across all timeframes.
- Momentum indicators are weak, with relative strength and stochastic measures both showing an oversold condition.
- Expected 5-day price range is $7.19 to $8.07, with a high likelihood of further downside below $7.19.
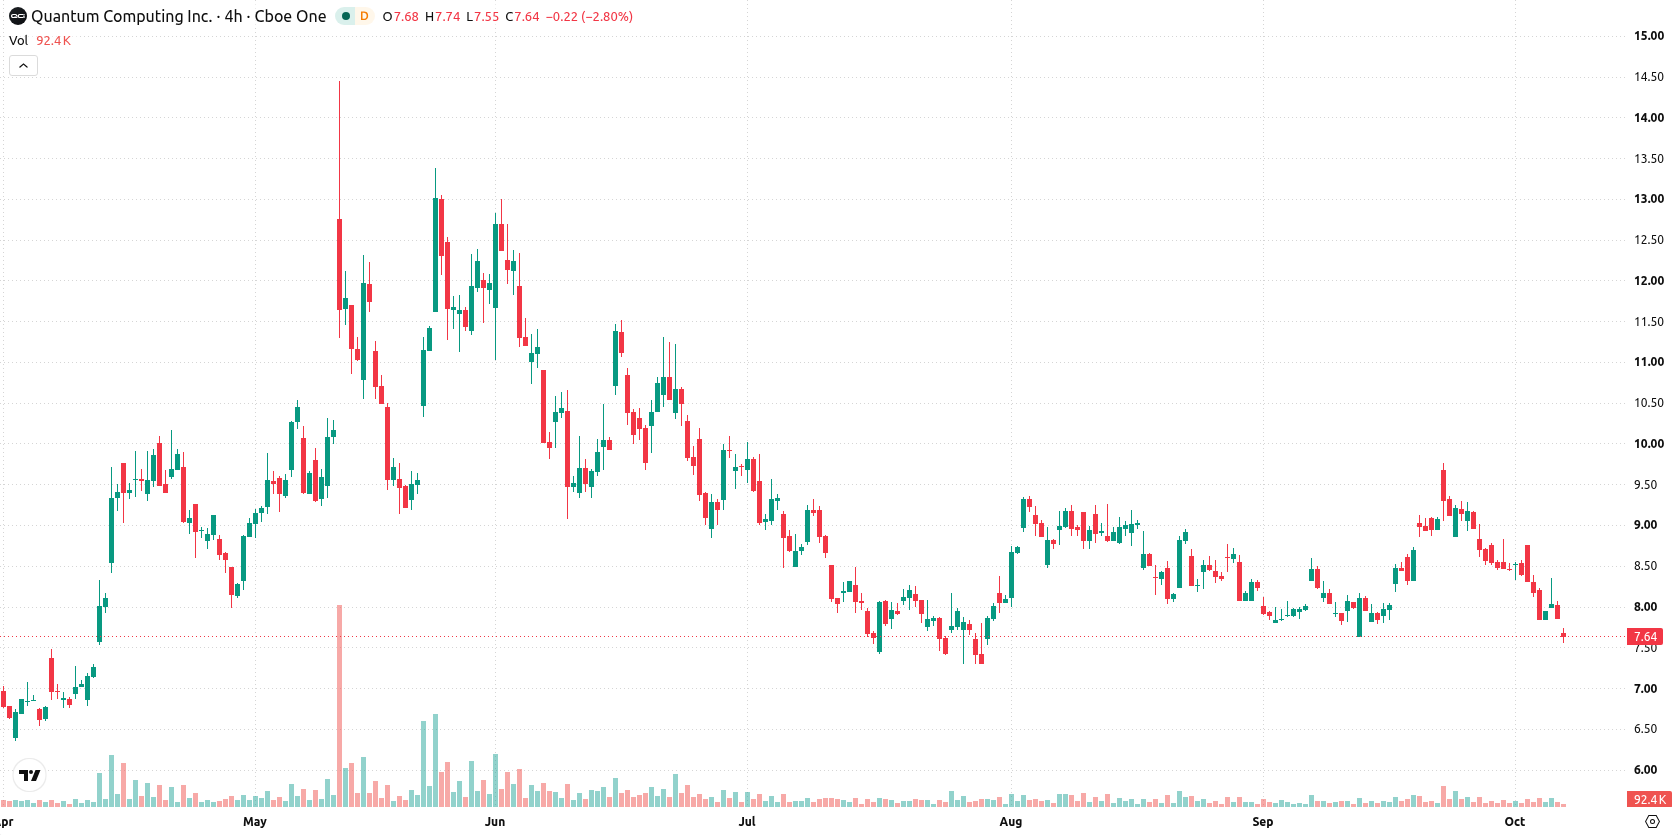
Bearish momentum confirmed as price remains under key averages
QUBT is trading below its 20-day ($8.40), 50-day ($8.44), and 200-day ($9.16) moving averages, highlighting a sustained bearish technical structure across all timeframes. Immediate resistance is seen at $7.83, with support at $7.19, and the longer-term trend remains negative, reinforced by the 50-day and 200-day averages and distant Ichimoku Kijun resistance at $8.67. Momentum indicators show pronounced weakness: the MACD and ADX are neutral, but the RSI is low at 38.51 with a "Sell" signal, CCI sits at -71.14 ("Sell"), and the Stochastic RSI is fully oversold at 0. Bull/Bear Power is barely positive at 0.01, suggesting weak buyer presence intraday, while the Awesome Oscillator confirms the prevailing downtrend. Price action consolidated near session lows, with intraday volatility amplitude of 5.72% as most signals point to seller control and only scattered oversold readings hint at near-term exhaustion.
Earlier, analysts noted that Quantum Computing Inc. faced sustained bearish pressure as technical indicators showed a persistent downtrend. The current analysis reinforces this negative outlook, highlighting $8.07 as a key resistance level for any potential reversal in the coming sessions.






Latest Quantum Computing News





-
 Afghanistan
-
 Albania
-
 Algeria
-
 Angola
-
 Argentina
-
 Armenia
-
 Australia
-
 Austria
-
 Azerbaijan
-
 Bahamas
-
 Bahrain
-
 Bangladesh
-
 Belarus
-
 Belgium
-
 Bolivia
-
 Botswana
-
 Brazil
-
 Brunei
-
 Bulgaria
-
 Cambodia
-
 Cameroon
-
 Canada
-
 Chile
-
 China
-
 Colombia
-
 Congo
-
 Costa Rica
-
 Cote d'Ivoire
-
 Croatia
-
 Cuba
-
 Cyprus
-
 Czechia
-
 DR Congo
-
 Denmark
-
 Dominican Republic
-
 Ecuador
-
 Egypt
-
 El Salvador
-
 Estonia
-
 Eswatini
-
 Ethiopia
-
 Finland
-
 France
-
 Georgia
-
 Germany
-
 Ghana
-
 Greece
-
 Haiti
-
 Hong Kong
-
 Hungary
-
 India
-
 Indonesia
-
 Iran, Islamic republic
-
 Iraq
-
 Ireland
-
 Israel
-
 Italy
-
 Jamaica
-
 Japan
-
 Jordan
-
 Kazakhstan
-
 Kenya
-
 Korea
-
 Kuwait
-
 Kyrgyzstan
-
 Laos
-
 Latvia
-
 Lebanon
-
 Lesotho
-
 Libya
-
 Lithuania
-
 Luxembourg
-
 Madagascar
-
 Malaysia
-
 Malta
-
 Mauritius
-
 Mexico
-
 Moldova
-
 Mongolia
-
 Montenegro
-
 Morocco
-
 Mozambique
-
 Myanmar
-
 Namibia
-
 Nepal
-
 Netherlands
-
 New Zealand
-
 Nigeria
-
 North Macedonia
-
 Norway
-
 Oman
-
 Pakistan
-
 Palestine
-
 Panama
-
 Papua New Guinea
-
 Paraguay
-
 Peru
-
 Philippines
-
 Poland
-
 Portugal
-
 Puerto Rico
-
 Qatar
-
 Reunion
-
 Romania
-
 Rwanda
-
 Saudi Arabia
-
 Serbia
-
 Singapore
-
 Slovakia
-
 Slovenia
-
 Somalia
-
 South Africa
-
 Spain
-
 Sri Lanka
-
 Sweden
-
 Switzerland
-
 Syria
-
 Taiwan
-
 Tajikistan
-
 Tanzania
-
 Thailand
-
 Trinidad and Tobago
-
 Tunisia
-
 Turkey
-
 UAE
-
 Uganda
-
 Ukraine
-
 United Kingdom
-
United States
-
 Uruguay
-
 Uzbekistan
-
 Venezuela
-
 Vietnam
-
 Yemen
-
 Zambia
-
 Zimbabwe
- Forex
- Crypto












