


Strategy (MSTR, formerly MicroStrategy) stock is trading at $157.03, gaining 3.67% on the day and ending near its session high. The price remains above its key short-term moving averages but faces medium-term resistance, reflecting high volatility and strong intraday momentum.
 134.51
144.69
Highlights
- Strategy Inc. increased its Bitcoin holdings to a record 848,000 BTC after purchasing an additional 334 BTC using share sales and cash.
- The company reaffirmed a 12% annual dividend on its Variable Rate Series A Preferred Stock, with new semi-monthly payouts confirmed for October and November 2026.
- Shares display short-term positive bias but bearish momentum, with MSTR/USD expected to range between $146.53 and $166.57, and a high probability of decline.
Bitcoin accumulation and dividend policy drive speculative flows and income appeal
Strategy Inc. disclosed in a Form 8-K filing on October 8, 2026, that its Bitcoin reserves reached an all-time high of 848,000 BTC after acquiring an additional 334 BTC through share sales and cash, an action that increases the company’s direct exposure to crypto market moves and underpins speculative interest in the shares, according to Cryptotimes. This follows the company's reaffirmation of a 12% annual dividend rate on its Variable Rate Series A Perpetual Stretch Preferred Stock (STRC), with new semi-monthly payouts set for October and November 2026, which secures ongoing income appeal for shareholders, as reported by Simplywall. Additionally, anticipation surrounds the scheduled third-quarter earnings call for 2026 on October 29, which could catalyze further positioning among investors ahead of fresh financial disclosures.
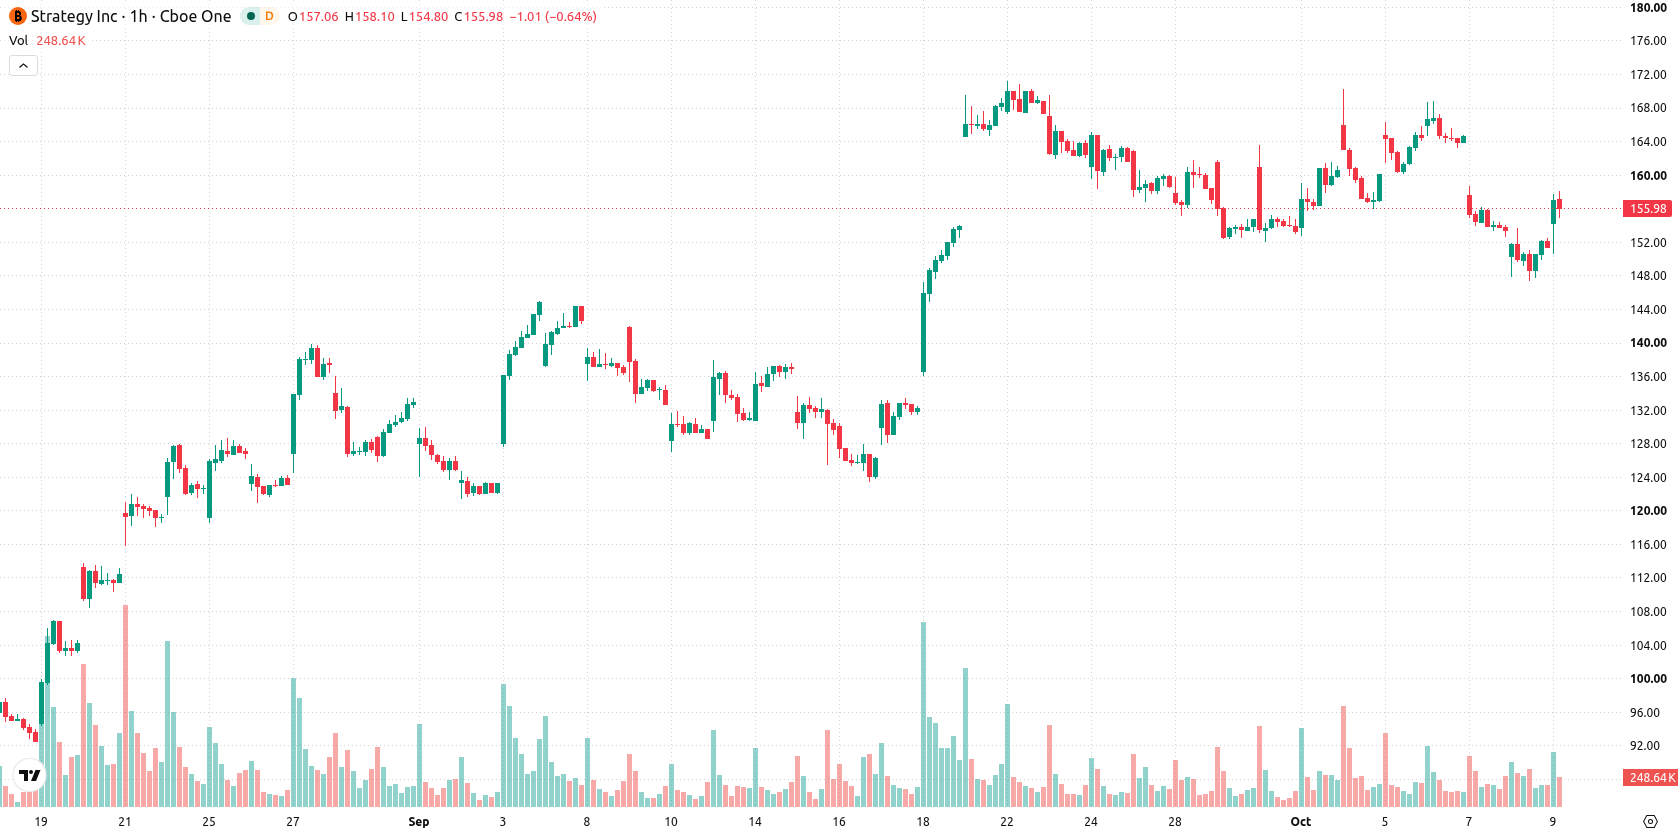
Momentum weakness as overbought signals clash with seller dominance
On the hourly chart, MSTR trades above the MA-20 while remaining below the MA-50, with daily price action well supported above the MA-200. The Ichimoku Kijun level at $158.08 acts as the nearest resistance. Momentum indicators remain weak: both MACD and ADX are on a Sell signal. Intraday oscillators, including RSI and CCI, signal additional downside, while Stoch RSI is overbought, flagging exhausted short-term buying power. Bull/Bear Power is oversold, pointing to pronounced seller dominance during the session. Persistent divergences between overbought oscillators and ongoing downward momentum suggest that risks remain skewed to the downside.
Bearish bias as breakout risk persists within defined trading band
The forecast for MSTR over the next few days suggests a likely trading range between $146.53 and $166.57, reflecting typical volatility for the stock at current levels. The probability of an immediate upward move is very low, with a high likelihood of a pullback within the indicated band. Should the price break above the $158.08 resistance, further upside could be triggered in a bullish scenario. In contrast, a move below $146.53 would confirm accelerated downside and mark a bearish breakout.
Earlier, analysts noted that Strategy was under ongoing balance-sheet strain and facing amplified downside risk amid heightened exposure to digital assets. The current analysis adds that, while the company has expanded its Bitcoin holdings and maintains strong short-term momentum, traders should watch the $158.08 resistance and $146.53 support levels for the next significant move.






Latest Strategy News




-
 Afghanistan
-
 Albania
-
 Algeria
-
 Angola
-
 Argentina
-
 Armenia
-
 Australia
-
 Austria
-
 Azerbaijan
-
 Bahamas
-
 Bahrain
-
 Bangladesh
-
 Belarus
-
 Belgium
-
 Bolivia
-
 Botswana
-
 Brazil
-
 Brunei
-
 Bulgaria
-
 Cambodia
-
 Cameroon
-
 Canada
-
 Chile
-
 China
-
 Colombia
-
 Congo
-
 Costa Rica
-
 Cote d'Ivoire
-
 Croatia
-
 Cuba
-
 Cyprus
-
 Czechia
-
 DR Congo
-
 Denmark
-
 Dominican Republic
-
 Ecuador
-
 Egypt
-
 El Salvador
-
 Estonia
-
 Eswatini
-
 Ethiopia
-
 Finland
-
 France
-
 Georgia
-
 Germany
-
 Ghana
-
 Greece
-
 Haiti
-
 Hong Kong
-
 Hungary
-
 India
-
 Indonesia
-
 Iran, Islamic republic
-
 Iraq
-
 Ireland
-
 Israel
-
 Italy
-
 Jamaica
-
 Japan
-
 Jordan
-
 Kazakhstan
-
 Kenya
-
 Korea
-
 Kuwait
-
 Kyrgyzstan
-
 Laos
-
 Latvia
-
 Lebanon
-
 Lesotho
-
 Libya
-
 Lithuania
-
 Luxembourg
-
 Madagascar
-
 Malaysia
-
 Malta
-
 Mauritius
-
 Mexico
-
 Moldova
-
 Mongolia
-
 Montenegro
-
 Morocco
-
 Mozambique
-
 Myanmar
-
 Namibia
-
 Nepal
-
 Netherlands
-
 New Zealand
-
 Nigeria
-
 North Macedonia
-
 Norway
-
 Oman
-
 Pakistan
-
 Palestine
-
 Panama
-
 Papua New Guinea
-
 Paraguay
-
 Peru
-
 Philippines
-
 Poland
-
 Portugal
-
 Puerto Rico
-
 Qatar
-
 Reunion
-
 Romania
-
 Rwanda
-
 Saudi Arabia
-
 Serbia
-
 Singapore
-
 Slovakia
-
 Slovenia
-
 Somalia
-
 South Africa
-
 Spain
-
 Sri Lanka
-
 Sweden
-
 Switzerland
-
 Syria
-
 Taiwan
-
 Tajikistan
-
 Tanzania
-
 Thailand
-
 Trinidad and Tobago
-
 Tunisia
-
 Turkey
-
 UAE
-
 Uganda
-
 Ukraine
-
 United Kingdom
-
United States
-
 Uruguay
-
 Uzbekistan
-
 Venezuela
-
 Vietnam
-
 Yemen
-
 Zambia
-
 Zimbabwe
- Forex
- Crypto












