

AstraZeneca stock consolidates amid mixed clinical trial results and new oncology partnership

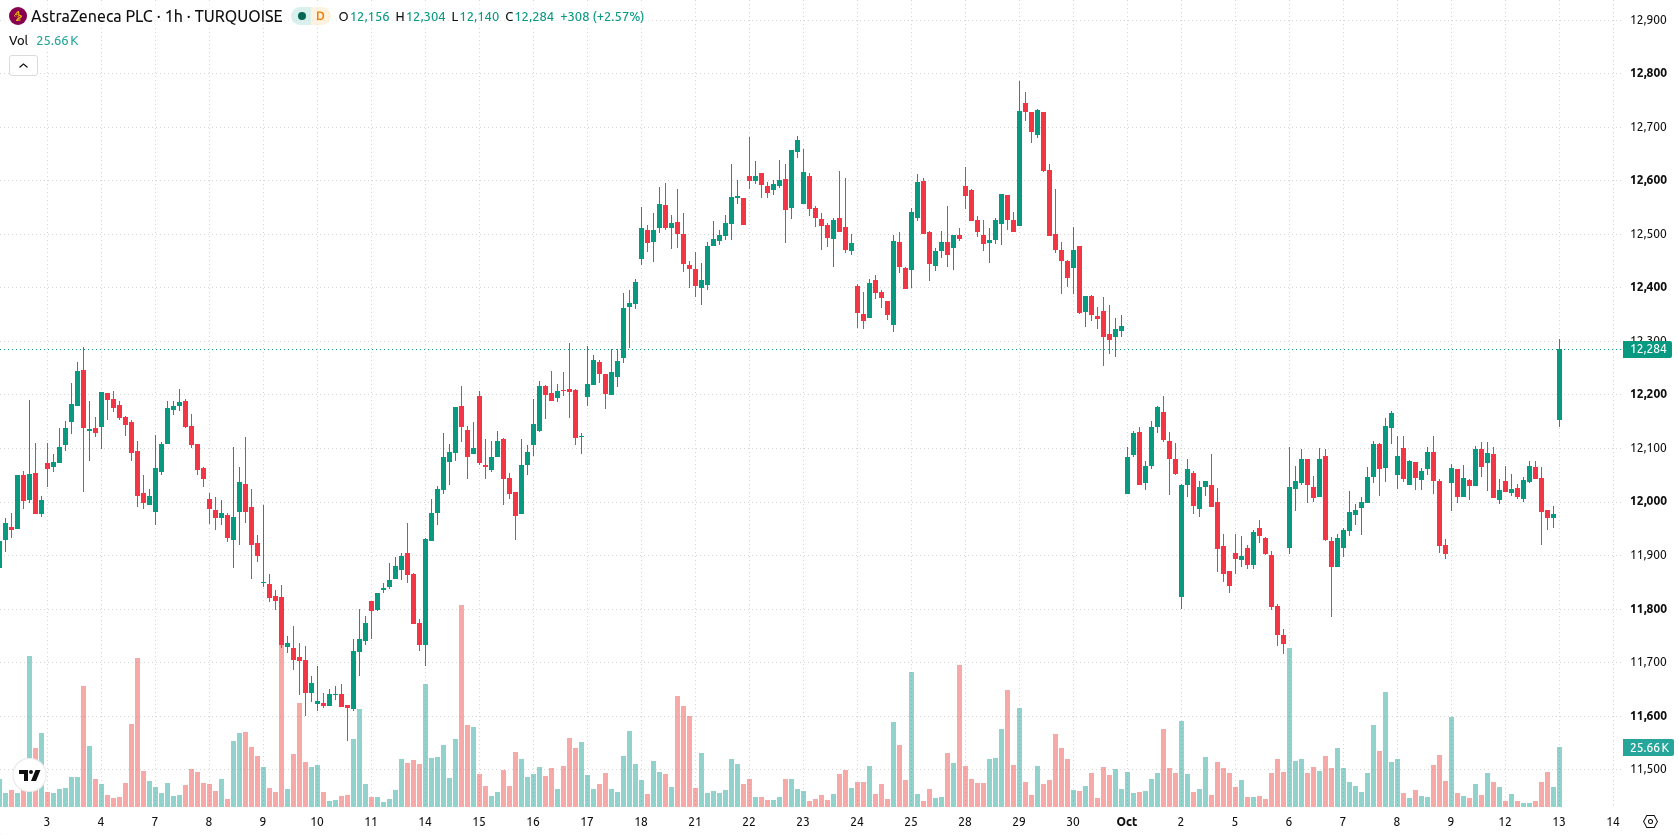
AstraZeneca (AZN) stock is trading at GBX11,976 after a modest decline in the latest session. It sits below its key moving averages, reflecting a broadly negative short-term setup.
 12078.00
12180.00
12078.00
12180.00
Highlights
- AstraZeneca reported its Phase III HICKORY trial for efzimfotase alfa did not meet the primary endpoint, raising regulatory uncertainty for future revenue.
- AstraZeneca expanded its pipeline with a joint oncology programme with Summit Therapeutics and the opening of a new US R&D centre.
- Shares of AstraZeneca trade below key moving averages with weak momentum signals, and the short-term price range is GBX11,798 to GBX12,153 with high probability of further downside.
Regulatory setbacks offset innovation gains amid pipeline expansion
AstraZeneca presented results from the Phase III HICKORY trial of efzimfotase alfa for hypophosphatasia, with findings showing that the primary endpoint was not met, while secondary measures improved and the drug remains under regulatory review, according to Benzinga. This outcome introduces regulatory uncertainty for potential future revenue from efzimfotase alfa, weighing on near-term sentiment. Separately, AstraZeneca took a significant stake in Summit Therapeutics and formed a joint oncology programme addressing clinical studies in gastrointestinal tumors, according to Kalkinemedia, and also opened a major new R&D centre in the US, noted by Pmlive. These developments expand the pipeline and strengthen longer-term innovation, though price action has remained under broader selling pressure.
Technical weakness persists as momentum indicators oversold
On the technical front, AZN is trading beneath its MA-20 at GBX12,019 and MA-50 at GBX12,008 on the hourly chart, with the daily MA-200 at GBX13,518 forming longer-term overhead resistance. The Ichimoku Kijun sits at GBX12,007 as the nearest upside cap, while momentum remains negative: both the MACD and Awesome Oscillator indicate a sell bias and the ADX is neutral. Intraday, oscillators including the RSI at 44.9, Stochastic RSI, and CCI are oversold, and Bull/Bear Power continues to point toward seller dominance. This suggests technical weakness, though short-term selling pressure shows signs of being overstretched on oscillators.
Downside risk elevated as breakout probability remains subdued
In the short term, the expected price range for AZN is GBX11,798 to GBX12,153, reflecting the typical volatility band relative to current levels. The probability of an upward breakout is very low, whereas the risk of a downward continuation is high. If the price remains within this corridor, sideways consolidation is likely; a move above GBX12,007 would open the door to a bullish scenario, while a close below GBX11,798 would signal further downside.
Earlier, analysts noted that AstraZeneca shares remained under technical pressure despite pipeline developments, with downside risks seen as the prevailing scenario. This latest update strengthens that view, as persistent weakness below key moving averages and continued negative momentum keep downside continuation the key scenario to watch.





Latest AstraZeneca News





-
 Afghanistan
-
 Albania
-
 Algeria
-
 Angola
-
 Argentina
-
 Armenia
-
 Australia
-
 Austria
-
 Azerbaijan
-
 Bahamas
-
 Bahrain
-
 Bangladesh
-
 Belarus
-
 Belgium
-
 Bolivia
-
 Botswana
-
 Brazil
-
 Brunei
-
 Bulgaria
-
 Cambodia
-
 Cameroon
-
 Canada
-
 Chile
Chile
-
 China
China
-
 Colombia
-
 Congo
Congo
-
 Costa Rica
-
 Cote d'Ivoire
-
 Croatia
-
 Cuba
Cuba
-
 Cyprus
-
 Czechia
-
 DR Congo
-
 Denmark
-
 Dominican Republic
-
 Ecuador
-
 Egypt
Egypt
-
 El Salvador
-
 Estonia
-
 Eswatini
-
 Ethiopia
-
 Finland
-
 France
-
 Georgia
-
 Germany
-
 Ghana
Ghana
-
 Greece
-
 Haiti
Haiti
-
 Hong Kong
-
 Hungary
-
 India
India
-
 Indonesia
-
 Iran, Islamic republic
-
 Iraq
Iraq
-
 Ireland
-
 Israel
-
 Italy
Italy
-
 Jamaica
-
 Japan
Japan
-
 Jordan
-
 Kazakhstan
-
 Kenya
Kenya
-
 Korea
Korea
-
 Kuwait
-
 Kyrgyzstan
-
 Laos
Laos
-
 Latvia
-
 Lebanon
-
 Lesotho
-
 Libya
Libya
-
 Lithuania
-
 Luxembourg
-
 Madagascar
-
 Malaysia
-
 Malta
Malta
-
 Mauritius
-
 Mexico
-
 Moldova
-
 Mongolia
-
 Montenegro
-
 Morocco
-
 Mozambique
-
 Myanmar
-
 Namibia
-
 Nepal
Nepal
-
 Netherlands
-
 New Zealand
-
 Nigeria
-
 North Macedonia
-
 Norway
-
 Oman
Oman
-
 Pakistan
-
 Palestine
-
 Panama
-
 Papua New Guinea
-
 Paraguay
-
 Peru
Peru
-
 Philippines
-
 Poland
-
 Portugal
-
 Puerto Rico
-
 Qatar
Qatar
-
 Reunion
-
 Romania
-
 Rwanda
-
 Saudi Arabia
-
 Serbia
-
 Singapore
-
 Slovakia
-
 Slovenia
-
 Somalia
-
 South Africa
-
 Spain
Spain
-
 Sri Lanka
-
 Sweden
-
 Switzerland
-
 Syria
Syria
-
 Taiwan
-
 Tajikistan
-
 Tanzania
-
 Thailand
-
 Trinidad and Tobago
-
 Tunisia
-
 Turkey
-
 UAE
UAE
-
 Uganda
-
 Ukraine
-
 United Kingdom
-
United States
-
 Uruguay
-
 Uzbekistan
-
 Venezuela
-
 Vietnam
-
 Yemen
Yemen
-
 Zambia
-
 Zimbabwe
- Forex
- Crypto












