

BP stock consolidates near recent highs as buyers provide support

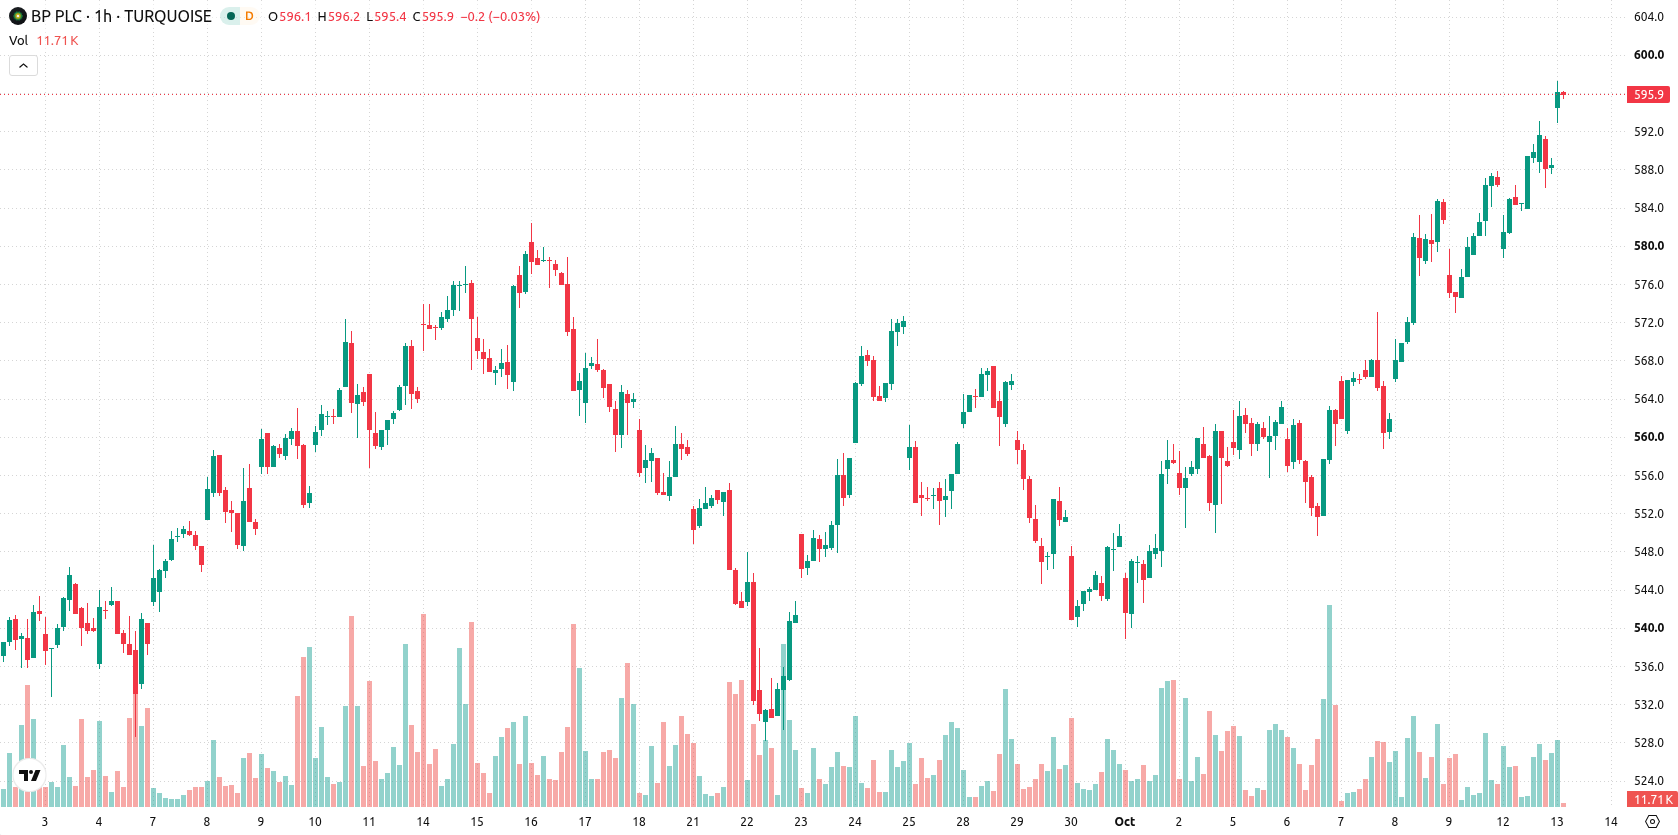
BP (BP) stock is trading at GBX588.5, posting a slight gain for the day. The price currently sits above its key moving averages, highlighting its strength relative to recent trading levels.
 593.20
593.20
593.20
Highlights
- BP stock is in a bullish setup, trading above short-, medium-, and long-term moving averages across timeframes.
- Technical momentum remains positive, with multiple indicators such as MACD, ADX, RSI, and CCI all showing buy signals.
- BP stock closed at GBX588.5, with the projected price range for coming days at GBX568.96 to GBX608.04.
Technical momentum strengthens as buy signals align with support
On the hourly chart, BP is trading above the MA-20 at GBX583.97 and MA-50 at GBX572.33, while on the daily timeframe it remains above the MA-200 at GBX519.27. The Ichimoku Kijun at GBX580.29 marks a key support level. Momentum indicators show MACD in strong buy mode and ADX also indicating buying conditions. RSI is at 61.8, CCI is in buy territory, and Bull/Bear Power also highlights buyer dominance, while Stoch RSI and the Awesome Oscillator are both neutral. BP has closed near the top of today's range amid moderate volatility.
Bullish bias dominates as upside scenario outweighs consolidation risk
Looking ahead, BP is expected to trade in a range between GBX568.96 and GBX608.04 over the coming days, reflecting typical volatility. The probability of an upside move is very high, while a break below support at the Kijun (GBX580.29) would be required to open a bearish scenario. Baseline expectations are for BP to continue consolidating within this corridor unless a key technical level is breached.
Previously it was reported that BP’s improved balance sheet boosted by higher energy prices, was enabling the company to reset strategic priorities ahead of schedule. The current technical outlook aligns with this strengthening fundamental position, making GBX580.29 a critical support level to monitor for potential shifts in the short-term trading scenario.





Latest BP News






-
 Afghanistan
-
 Albania
-
 Algeria
-
 Angola
-
 Argentina
-
 Armenia
-
 Australia
-
 Austria
-
 Azerbaijan
-
 Bahamas
-
 Bahrain
-
 Bangladesh
-
 Belarus
-
 Belgium
-
 Bolivia
-
 Botswana
-
 Brazil
-
 Brunei
-
 Bulgaria
-
 Cambodia
-
 Cameroon
-
 Canada
-
 Chile
Chile
-
 China
China
-
 Colombia
-
 Congo
Congo
-
 Costa Rica
-
 Cote d'Ivoire
-
 Croatia
-
 Cuba
Cuba
-
 Cyprus
-
 Czechia
-
 DR Congo
-
 Denmark
-
 Dominican Republic
-
 Ecuador
-
 Egypt
Egypt
-
 El Salvador
-
 Estonia
-
 Eswatini
-
 Ethiopia
-
 Finland
-
 France
-
 Georgia
-
 Germany
-
 Ghana
Ghana
-
 Greece
-
 Haiti
Haiti
-
 Hong Kong
-
 Hungary
-
 India
India
-
 Indonesia
-
 Iran, Islamic republic
-
 Iraq
Iraq
-
 Ireland
-
 Israel
-
 Italy
Italy
-
 Jamaica
-
 Japan
Japan
-
 Jordan
-
 Kazakhstan
-
 Kenya
Kenya
-
 Korea
Korea
-
 Kuwait
-
 Kyrgyzstan
-
 Laos
Laos
-
 Latvia
-
 Lebanon
-
 Lesotho
-
 Libya
Libya
-
 Lithuania
-
 Luxembourg
-
 Madagascar
-
 Malaysia
-
 Malta
Malta
-
 Mauritius
-
 Mexico
-
 Moldova
-
 Mongolia
-
 Montenegro
-
 Morocco
-
 Mozambique
-
 Myanmar
-
 Namibia
-
 Nepal
Nepal
-
 Netherlands
-
 New Zealand
-
 Nigeria
-
 North Macedonia
-
 Norway
-
 Oman
Oman
-
 Pakistan
-
 Palestine
-
 Panama
-
 Papua New Guinea
-
 Paraguay
-
 Peru
Peru
-
 Philippines
-
 Poland
-
 Portugal
-
 Puerto Rico
-
 Qatar
Qatar
-
 Reunion
-
 Romania
-
 Rwanda
-
 Saudi Arabia
-
 Serbia
-
 Singapore
-
 Slovakia
-
 Slovenia
-
 Somalia
-
 South Africa
-
 Spain
Spain
-
 Sri Lanka
-
 Sweden
-
 Switzerland
-
 Syria
Syria
-
 Taiwan
-
 Tajikistan
-
 Tanzania
-
 Thailand
-
 Trinidad and Tobago
-
 Tunisia
-
 Turkey
-
 UAE
UAE
-
 Uganda
-
 Ukraine
-
 United Kingdom
-
United States
-
 Uruguay
-
 Uzbekistan
-
 Venezuela
-
 Vietnam
-
 Yemen
Yemen
-
 Zambia
-
 Zimbabwe
- Forex
- Crypto












