

ServiceNow shares weekly forecast: Overbought signals emerge as resistance at $148.14 comes into focus

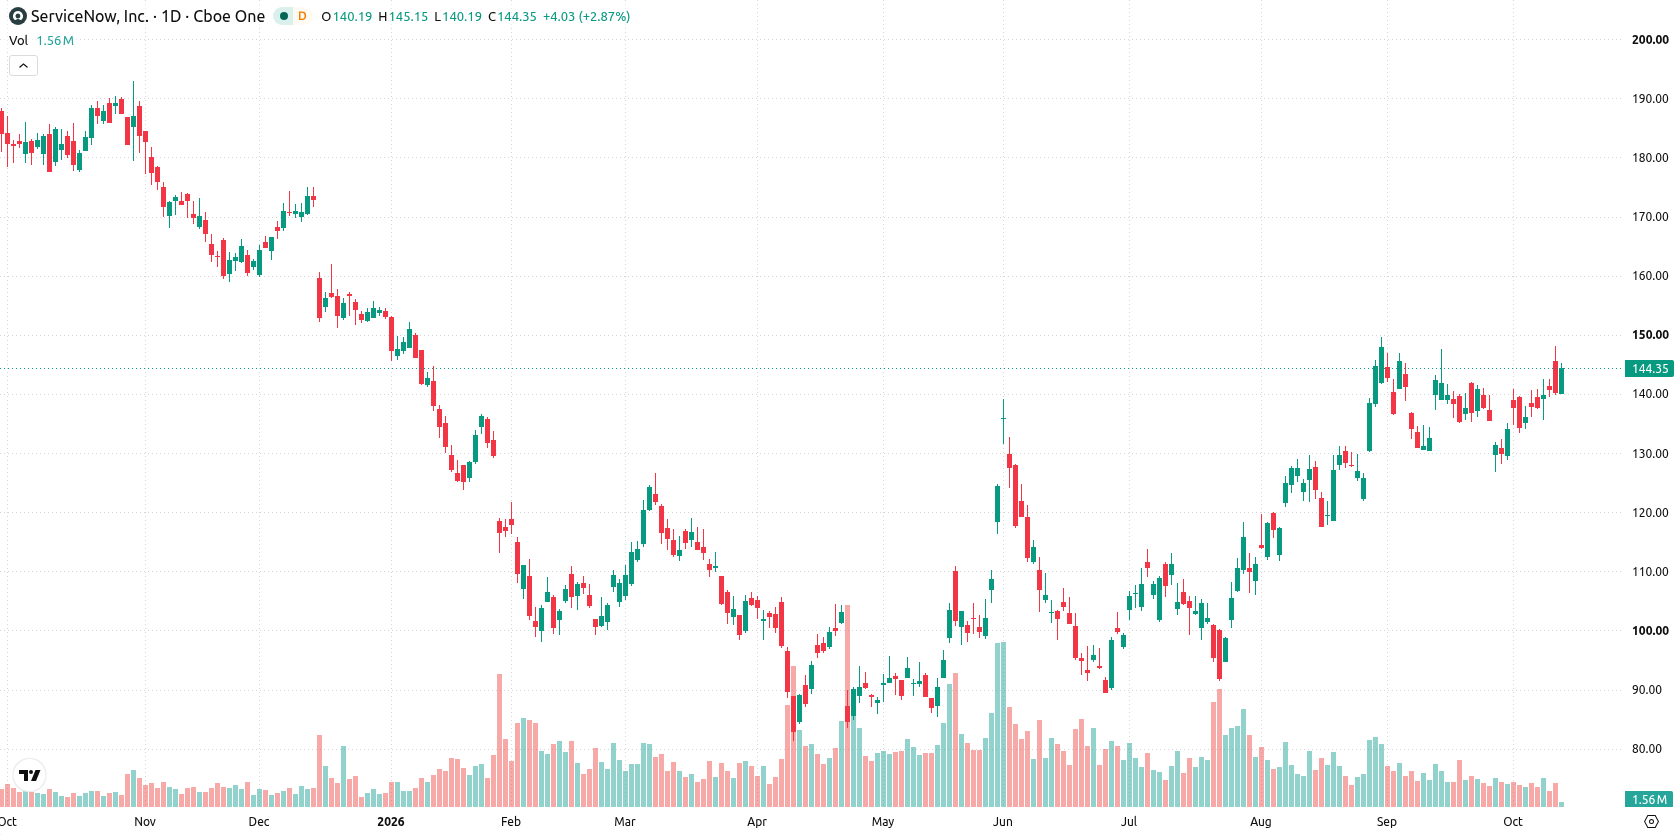
Shares of ServiceNow (NOW) are trading near $144 and climbed more than 2% over the past week as recovery momentum continues. Corporate gains remain supported by robust demand, but a stretched technical setup could test the stock’s resilience heading into next week.
 145.17
148.14
145.17
148.14
Highlights
- Shares of ServiceNow rose to $144.26 over the past week, trading well above key short-term averages.
- Technical signals show an overbought condition with momentum stretched, indicating possible near-term consolidation.
- The projected range for next week is $138.69 to $149.82, with resistance at $148.14 and support at $137.56.
Mixed earnings and AI investment shape sentiment as institutional adoption grows
ServiceNow posted 24% revenue growth alongside a 22.6% earnings decline, attributed to elevated spending on sales and engineering to back new AI-driven products, according to Yahoo Finance. The company also recently landed high-profile customer wins in markets like Raleigh and the Bundesliga (source: Yahoo Finance). Ongoing investment in AI workflow tools and solid institutional adoption remain in focus for the week ahead.
Overbought technicals emerge as volatility jumps and upside risk persists
The daily setup shows a flat trend with a sharp move higher without a sustained trend, as weekly volatility reached 9.17%. MACD remains positive, while CCI at 138.46 and the Stoch RSI in the overbought zone flag stretched momentum. The nearest support is the Ichimoku Kijun at $137.56, while resistance sits at the recent high of $148.14. This mix of overbought signals and bullish structure points to possible near-term consolidation, but upside risk remains present if momentum persists.
Consolidation favored next week unless resistance breakout drives further upside
Next week, the expected range is $138.69 to $149.82, with a 77% probability of an increase and a 23% probability of a decrease. The base case scenario is consolidation between support at $137.56 and resistance at $148.14. A break above $148.14 would set up a push toward the top of the expected range. A move below $137.56 could open a pullback toward the lower boundary of the forecast.
Earlier, analysts noted that ServiceNow shares were consolidating as mixed technical signals and heightened volatility kept traders cautious about the potential for a breakout. The latest data confirm ongoing momentum, but with technicals stretched and volatility persisting, traders should monitor the $137.56 support and $148.14 resistance for any decisive move beyond the current consolidation range.





Latest ServiceNow News




-
 Afghanistan
-
 Albania
-
 Algeria
-
 Angola
-
 Argentina
-
 Armenia
-
 Australia
-
 Austria
-
 Azerbaijan
-
 Bahamas
-
 Bahrain
-
 Bangladesh
-
 Belarus
-
 Belgium
-
 Bolivia
-
 Botswana
-
 Brazil
-
 Brunei
-
 Bulgaria
-
 Cambodia
-
 Cameroon
-
 Canada
-
 Chile
Chile
-
 China
China
-
 Colombia
-
 Congo
Congo
-
 Costa Rica
-
 Cote d'Ivoire
-
 Croatia
-
 Cuba
Cuba
-
 Cyprus
-
 Czechia
-
 DR Congo
-
 Denmark
-
 Dominican Republic
-
 Ecuador
-
 Egypt
Egypt
-
 El Salvador
-
 Estonia
-
 Eswatini
-
 Ethiopia
-
 Finland
-
 France
-
 Georgia
-
 Germany
-
 Ghana
Ghana
-
 Greece
-
 Haiti
Haiti
-
 Hong Kong
-
 Hungary
-
 India
India
-
 Indonesia
-
 Iran, Islamic republic
-
 Iraq
Iraq
-
 Ireland
-
 Israel
-
 Italy
Italy
-
 Jamaica
-
 Japan
Japan
-
 Jordan
-
 Kazakhstan
-
 Kenya
Kenya
-
 Korea
Korea
-
 Kuwait
-
 Kyrgyzstan
-
 Laos
Laos
-
 Latvia
-
 Lebanon
-
 Lesotho
-
 Libya
Libya
-
 Lithuania
-
 Luxembourg
-
 Madagascar
-
 Malaysia
-
 Malta
Malta
-
 Mauritius
-
 Mexico
-
 Moldova
-
 Mongolia
-
 Montenegro
-
 Morocco
-
 Mozambique
-
 Myanmar
-
 Namibia
-
 Nepal
Nepal
-
 Netherlands
-
 New Zealand
-
 Nigeria
-
 North Macedonia
-
 Norway
-
 Oman
Oman
-
 Pakistan
-
 Palestine
-
 Panama
-
 Papua New Guinea
-
 Paraguay
-
 Peru
Peru
-
 Philippines
-
 Poland
-
 Portugal
-
 Puerto Rico
-
 Qatar
Qatar
-
 Reunion
-
 Romania
-
 Rwanda
-
 Saudi Arabia
-
 Serbia
-
 Singapore
-
 Slovakia
-
 Slovenia
-
 Somalia
-
 South Africa
-
 Spain
Spain
-
 Sri Lanka
-
 Sweden
-
 Switzerland
-
 Syria
Syria
-
 Taiwan
-
 Tajikistan
-
 Tanzania
-
 Thailand
-
 Trinidad and Tobago
-
 Tunisia
-
 Turkey
-
 UAE
UAE
-
 Uganda
-
 Ukraine
-
 United Kingdom
-
United States
-
 Uruguay
-
 Uzbekistan
-
 Venezuela
-
 Vietnam
-
 Yemen
Yemen
-
 Zambia
-
 Zimbabwe
- Forex
- Crypto












