

Tesla shares technical analysis: Weak momentum and buyer support define price

Tesla (TSLA) stock is trading at $375.2, with a modest move lower on the session. The price currently sits below its key moving averages.
 377.00
388.12
377.00
388.12
Highlights
- Tesla confirmed its third quarter 2026 earnings call for October 21, with full financial results and a management webcast scheduled.
- The formal announcement clarifies Tesla's near-term financial calendar and may influence positioning as investors await new disclosures.
- Shares of Tesla trade below key moving averages, with sellers retaining control and price projected to range from $366.32 to $384.08 in coming days.
Investor positioning shifts as earnings event adds clarity
Tesla has confirmed that its Q3 2026 earnings call will take place on October 21, 2026, with full financial results to be posted and a management webcast to follow, according to Basenor. The announcement sets a clear timeline for investors to anticipate significant financial updates, which may lead to increased market positioning ahead of the scheduled release. This scheduled event adds clarity to the near-term calendar and may influence sentiment as investors await new disclosure.
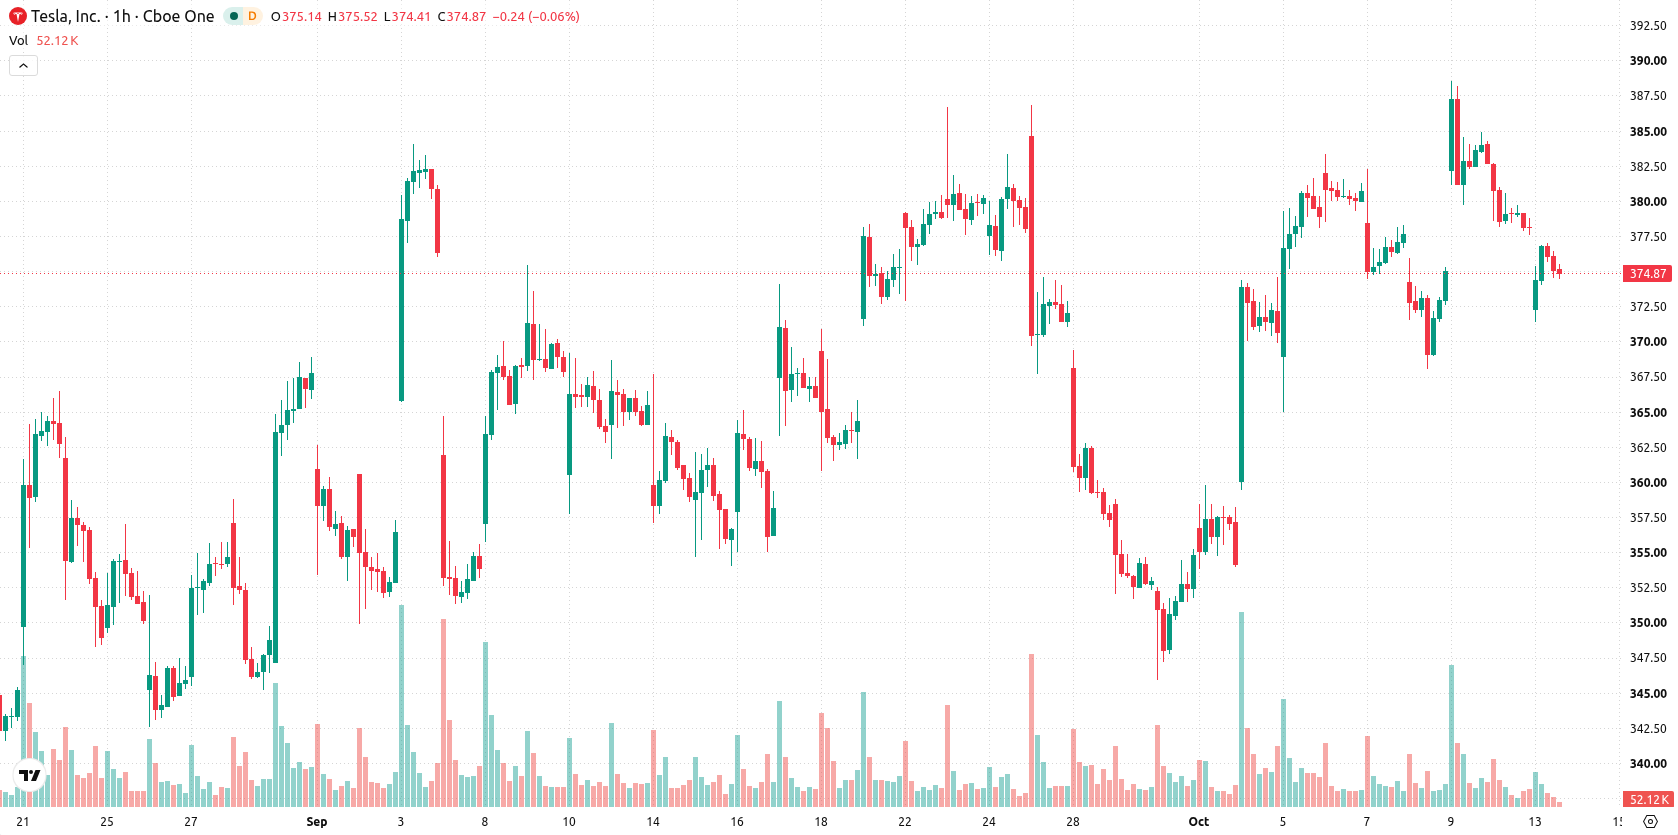
Mixed technical signals as sellers retain near-term control
On the hourly chart, TSLA trades below the MA-20 at $378.54 and the MA-50 at $377.64, with daily price action also below the MA-200 at $390.01. The Ichimoku Kijun level at $378.29 marks immediate resistance, while support is seen near $366.32. RSI is at 48.98 with a Sell signal, but MACD issues a Strong Buy. ADX remains Neutral. Stochastic RSI is Oversold, CCI is Neutral, and Bull/Bear Power confirms sellers maintain intraday control. The Awesome Oscillator is Neutral, suggesting no clear trend bias at this time.
Rangebound outlook prevails as resistance and support define path
Looking ahead, TSLA is forecast to trade within a typical volatility band between $366.32 and $384.08 over the next several days. The probability for an upward move is estimated at 55%, while the chance of further downside is 45%. The baseline scenario anticipates the price holding within this corridor. A bullish breakout would require a move above immediate resistance, while a breach of support would open a bearish scenario.
Earlier, analysts noted that Tesla shares were consolidating amid mixed technical signals and uncertainty ahead of its anticipated quarterly earnings release. With the stock now trading below key moving averages and short-term momentum favoring sellers, a decisive move above immediate resistance or below support will likely determine the next significant directional shift.











-
 Afghanistan
-
 Albania
-
 Algeria
-
 Angola
-
 Argentina
-
 Armenia
-
 Australia
-
 Austria
-
 Azerbaijan
-
 Bahamas
-
 Bahrain
-
 Bangladesh
-
 Belarus
-
 Belgium
-
 Bolivia
-
 Botswana
-
 Brazil
-
 Brunei
-
 Bulgaria
-
 Cambodia
-
 Cameroon
-
 Canada
-
 Chile
Chile
-
 China
China
-
 Colombia
-
 Congo
Congo
-
 Costa Rica
-
 Cote d'Ivoire
-
 Croatia
-
 Cuba
Cuba
-
 Cyprus
-
 Czechia
-
 DR Congo
-
 Denmark
-
 Dominican Republic
-
 Ecuador
-
 Egypt
Egypt
-
 El Salvador
-
 Estonia
-
 Eswatini
-
 Ethiopia
-
 Finland
-
 France
-
 Georgia
-
 Germany
-
 Ghana
Ghana
-
 Greece
-
 Haiti
Haiti
-
 Hong Kong
-
 Hungary
-
 India
India
-
 Indonesia
-
 Iran, Islamic republic
-
 Iraq
Iraq
-
 Ireland
-
 Israel
-
 Italy
Italy
-
 Jamaica
-
 Japan
Japan
-
 Jordan
-
 Kazakhstan
-
 Kenya
Kenya
-
 Korea
Korea
-
 Kuwait
-
 Kyrgyzstan
-
 Laos
Laos
-
 Latvia
-
 Lebanon
-
 Lesotho
-
 Libya
Libya
-
 Lithuania
-
 Luxembourg
-
 Madagascar
-
 Malaysia
-
 Malta
Malta
-
 Mauritius
-
 Mexico
-
 Moldova
-
 Mongolia
-
 Montenegro
-
 Morocco
-
 Mozambique
-
 Myanmar
-
 Namibia
-
 Nepal
Nepal
-
 Netherlands
-
 New Zealand
-
 Nigeria
-
 North Macedonia
-
 Norway
-
 Oman
Oman
-
 Pakistan
-
 Palestine
-
 Panama
-
 Papua New Guinea
-
 Paraguay
-
 Peru
Peru
-
 Philippines
-
 Poland
-
 Portugal
-
 Puerto Rico
-
 Qatar
Qatar
-
 Reunion
-
 Romania
-
 Rwanda
-
 Saudi Arabia
-
 Serbia
-
 Singapore
-
 Slovakia
-
 Slovenia
-
 Somalia
-
 South Africa
-
 Spain
Spain
-
 Sri Lanka
-
 Sweden
-
 Switzerland
-
 Syria
Syria
-
 Taiwan
-
 Tajikistan
-
 Tanzania
-
 Thailand
-
 Trinidad and Tobago
-
 Tunisia
-
 Turkey
-
 UAE
UAE
-
 Uganda
-
 Ukraine
-
 United Kingdom
-
United States
-
 Uruguay
-
 Uzbekistan
-
 Venezuela
-
 Vietnam
-
 Yemen
Yemen
-
 Zambia
-
 Zimbabwe
- Forex
- Crypto












