

Mastercard stock weekly forecast: Overbought signals challenge advance near key resistance

Shares of Mastercard Inc (MA) are trading near $603 after rising around 2% this week as a recovery takes hold, though conditions are starting to look stretched. The steady advance is being tested by overbought signals, setting the stage for a key week ahead as the upside momentum meets strong resistance.
 622.13
622.13
622.13
Highlights
- Shares of Mastercard closed at $602.76, gaining $13.13 over the past 7 days and remaining above key moving averages.
- Price action is contained at the top of its weekly range near resistance at $605.6, with volatility at 6.17%.
- The expected range for the coming week is $587.03 to $618.48, with bullish momentum tempered by overbought signals and key support at $575.81.
Earnings announcement and director sale shape sentiment as partnerships expand
Mastercard will release its third quarter 2026 financial results and host a conference call on October 29, 2026, according to Yahoo Finance. The week also saw Mastercard director Julius Genachowski sell $435,417 in company shares, as reported by Investing.com. Meanwhile, Mastercard launched a strategic partnership with WEX to modernize fleet payments in the Asia-Pacific region, while CEO Michael Miebach highlighted stablecoins for cross-border payments in tandem with a new collaboration with Visa and Stripe (sources: Finextra, Gurufocus).
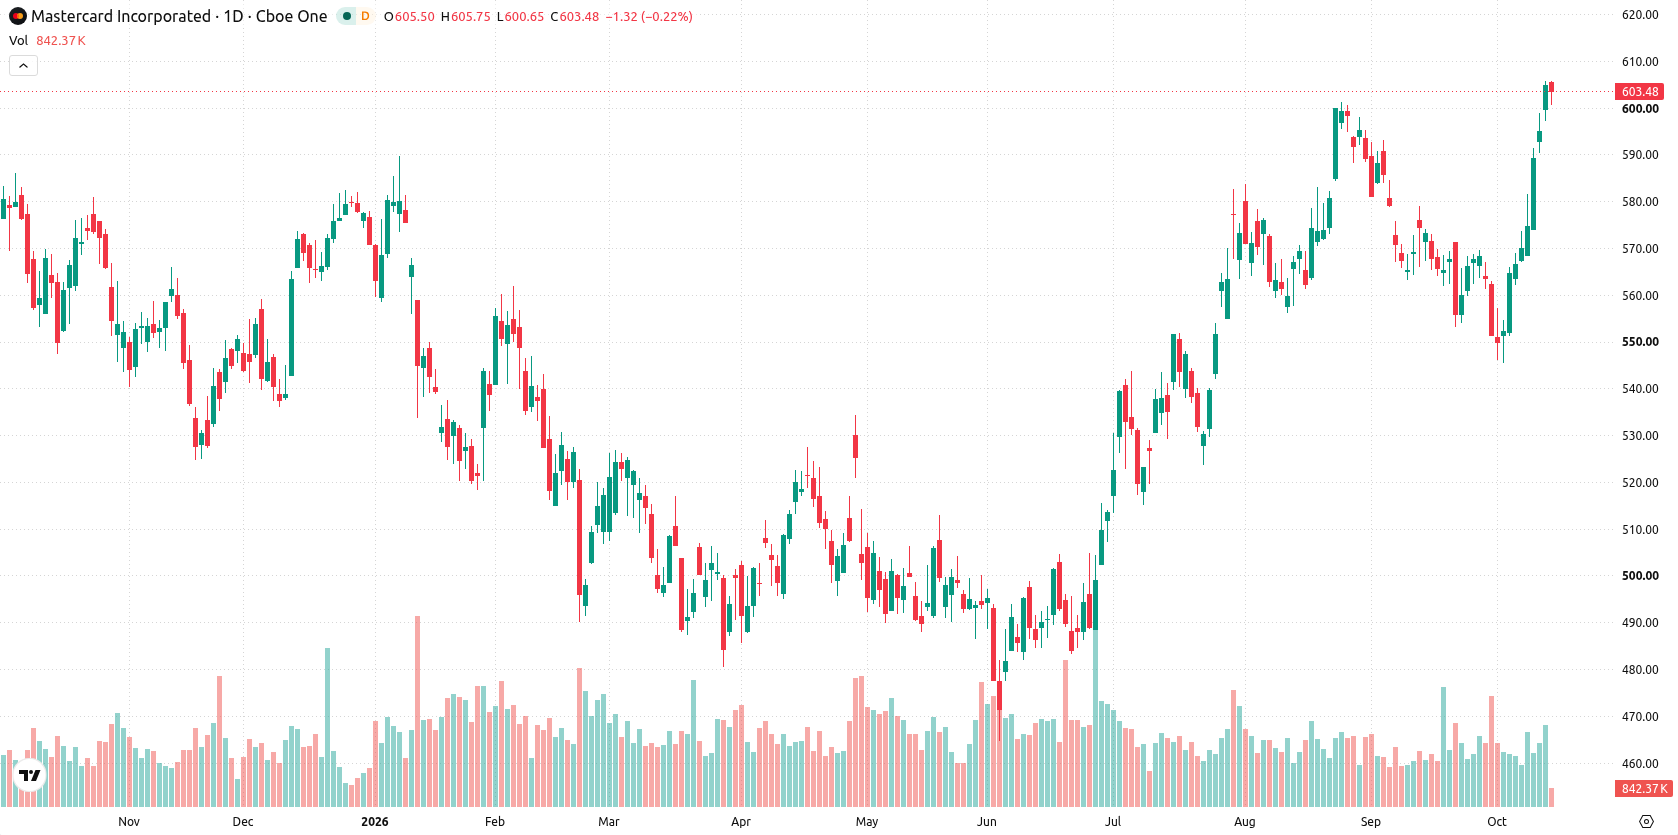
Buyers hold top of range as indicators flag overbought exhaustion risk
On the daily chart, Mastercard maintains a strong upside bias, sitting at the very top of its weekly range near key resistance at $605.6. Volatility over the week reached 6.17%, and momentum signals like RSI at 71.75 and CCI at 253.01 both flag an overbought condition, indicating potential for near-term exhaustion. However, the MACD remains supportive of continued buying, and the Ichimoku Kijun at $575.81 serves as robust nearby support. The move still appears contained within a narrow range, with buyers dominating but facing overhead resistance.
Upside bias persists in coming week unless consolidation breaks
For the coming trading week, the expected range is $587.03 to $618.48, with a very high probability of an increase and very low chance of a decrease. The base case calls for consolidation inside this range, guided by price action against the $605.6 resistance and $575.81 support. A sustained move above $605.6 could open the door to tests near $618.48, while loss of $575.81 would signal a shift toward the lower end of the expected range.
Earlier, analysts noted that Mastercard’s sustained momentum was supported by favorable sector trends, though they cautioned that technical signals pointed to potential overextension. The latest technical and fundamental developments reinforce this outlook, making the $605.6 resistance a critical level to watch as consolidation or a breakout will likely define near-term direction.




Latest Mastercard News






-
 Afghanistan
-
 Albania
-
 Algeria
-
 Angola
-
 Argentina
-
 Armenia
-
 Australia
-
 Austria
-
 Azerbaijan
-
 Bahamas
-
 Bahrain
-
 Bangladesh
-
 Belarus
-
 Belgium
-
 Bolivia
-
 Botswana
-
 Brazil
-
 Brunei
-
 Bulgaria
-
 Cambodia
-
 Cameroon
-
 Canada
-
 Chile
Chile
-
 China
China
-
 Colombia
-
 Congo
Congo
-
 Costa Rica
-
 Cote d'Ivoire
-
 Croatia
-
 Cuba
Cuba
-
 Cyprus
-
 Czechia
-
 DR Congo
-
 Denmark
-
 Dominican Republic
-
 Ecuador
-
 Egypt
Egypt
-
 El Salvador
-
 Estonia
-
 Eswatini
-
 Ethiopia
-
 Finland
-
 France
-
 Georgia
-
 Germany
-
 Ghana
Ghana
-
 Greece
-
 Haiti
Haiti
-
 Hong Kong
-
 Hungary
-
 India
India
-
 Indonesia
-
 Iran, Islamic republic
-
 Iraq
Iraq
-
 Ireland
-
 Israel
-
 Italy
Italy
-
 Jamaica
-
 Japan
Japan
-
 Jordan
-
 Kazakhstan
-
 Kenya
Kenya
-
 Korea
Korea
-
 Kuwait
-
 Kyrgyzstan
-
 Laos
Laos
-
 Latvia
-
 Lebanon
-
 Lesotho
-
 Libya
Libya
-
 Lithuania
-
 Luxembourg
-
 Madagascar
-
 Malaysia
-
 Malta
Malta
-
 Mauritius
-
 Mexico
-
 Moldova
-
 Mongolia
-
 Montenegro
-
 Morocco
-
 Mozambique
-
 Myanmar
-
 Namibia
-
 Nepal
Nepal
-
 Netherlands
-
 New Zealand
-
 Nigeria
-
 North Macedonia
-
 Norway
-
 Oman
Oman
-
 Pakistan
-
 Palestine
-
 Panama
-
 Papua New Guinea
-
 Paraguay
-
 Peru
Peru
-
 Philippines
-
 Poland
-
 Portugal
-
 Puerto Rico
-
 Qatar
Qatar
-
 Reunion
-
 Romania
-
 Rwanda
-
 Saudi Arabia
-
 Serbia
-
 Singapore
-
 Slovakia
-
 Slovenia
-
 Somalia
-
 South Africa
-
 Spain
Spain
-
 Sri Lanka
-
 Sweden
-
 Switzerland
-
 Syria
Syria
-
 Taiwan
-
 Tajikistan
-
 Tanzania
-
 Thailand
-
 Trinidad and Tobago
-
 Tunisia
-
 Turkey
-
 UAE
UAE
-
 Uganda
-
 Ukraine
-
 United Kingdom
-
United States
-
 Uruguay
-
 Uzbekistan
-
 Venezuela
-
 Vietnam
-
 Yemen
Yemen
-
 Zambia
-
 Zimbabwe
- Forex
- Crypto












