

Broadcom stock weekly forecast: Sellers keep pressure amid credit risk concerns

Shares of Broadcom Inc. (AVGO) are trading near $341 after falling nearly 6% this week, as a buildout in AI deals and new financial headwinds took hold. While robust AI demand helped power the company, shifting credit risks and tighter conditions are now shaping the outlook for the days ahead.
 339.42
360.58
339.42
360.58
Highlights
- Shares of Broadcom fell 5.75% over the past week to $341.1, now trading below key moving averages.
- Technical momentum is negative, with the MACD in sell mode and the stock in oversold territory.
- Expected 5-day range is $331.12 to $351.07, with over 80% probability of further decline and limited support nearby.
Investor caution rises as broader ai deals heighten credit and funding risks
Broadcom reported a sharp 86% year-over-year revenue jump to $29.6 billion in its third-quarter 2026 results, driven by a substantial 221% surge in AI chip sales, according to Timothy Sykes. CEO Hock Tan noted that, with chip supply improving, access to capital and rising financing costs have become the biggest constraints on further AI infrastructure growth, as reported by TheStreet. Investor interest remains elevated, but Broadcom’s increased exposure to large-scale financing agreements with AI clients like Anthropic and OpenAI is introducing new credit risks that could affect the company in the coming week.
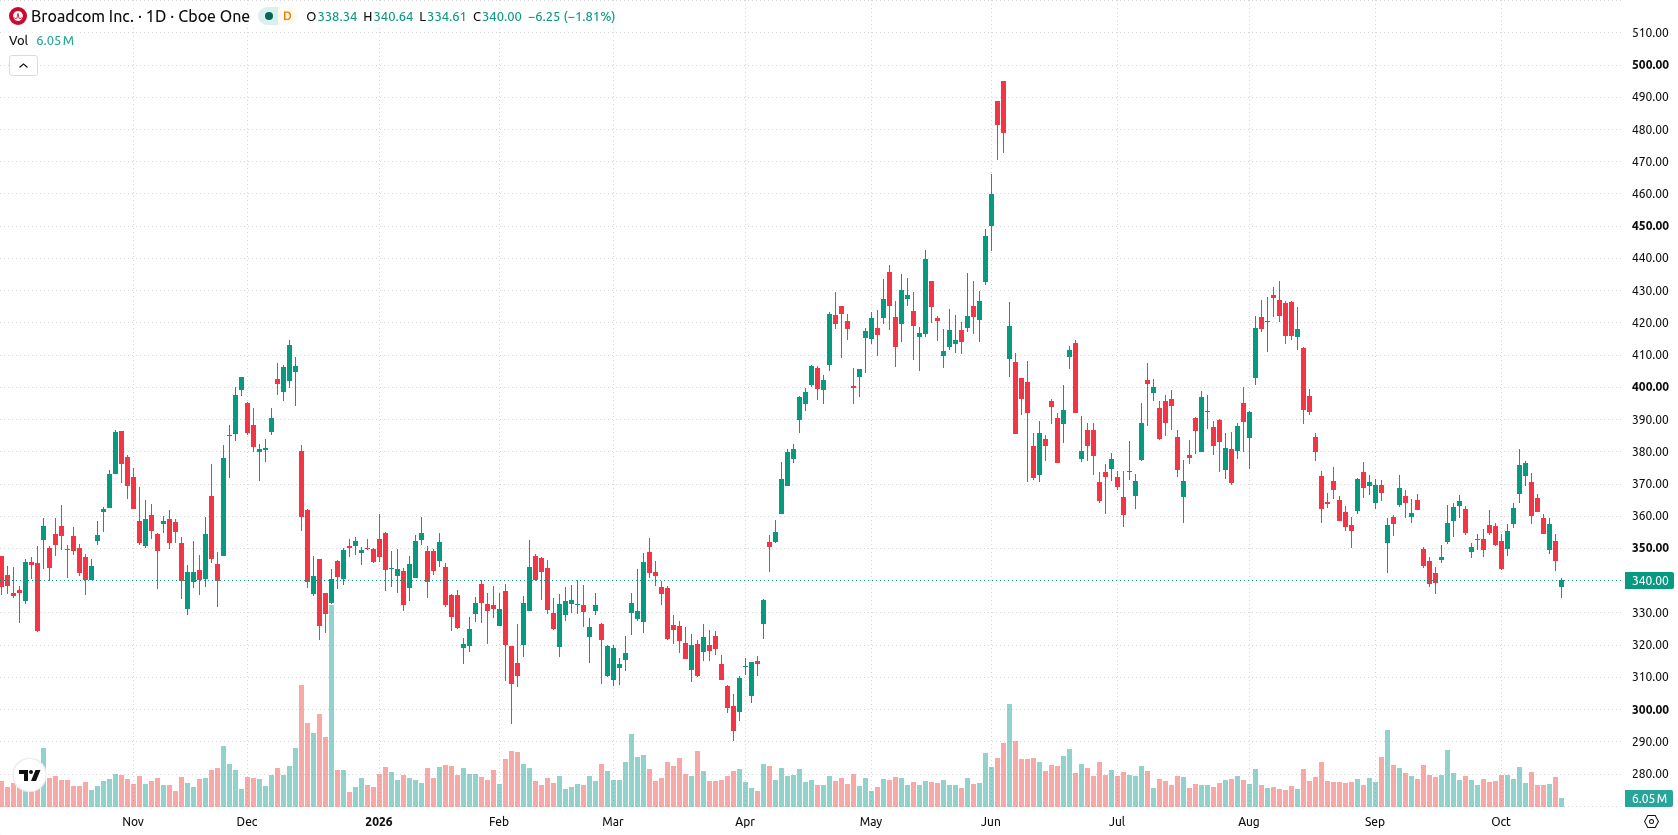
Bearish technical setup as volatility spikes and signals turn negative
The daily chart shows a contained move within a narrow range, as evidenced by 6.51% volatility over the past week. Momentum signals are mostly negative, with the MACD in sell mode and the Stochastic RSI reading 14.25, firmly in the oversold zone. Immediate resistance stands at $342.86 (the weekly low) with the Ichimoku Kijun at $358.34 likely to reinforce upside barriers. The absence of nearby support and dominance of bearish signals leave the technical outlook weak for Broadcom stock over the near term.
Consolidation expected with downside risk if key support fails next week
Over the next five trading days, the expected range is $331.12 to $351.07. There is a very high probability (more than 80%) of a further decrease and a very low probability (less than 20%) of a bounce. The base case is continued consolidation near the lower end of the range. A move above $342.86 would challenge immediate resistance, while any slip below $331.12 could see accelerating losses.
Earlier, analysts noted that Broadcom faced persistent downside pressure as chip supply issues eased, but tightening funding conditions emerged as the primary constraint on further growth. The current technical setup reinforces this outlook, with heightened credit risks and prevailing bearish momentum signaling that traders should watch for potential losses if support at $331.12 fails in the days ahead.










-
 Afghanistan
-
 Albania
-
 Algeria
-
 Angola
-
 Argentina
-
 Armenia
-
 Australia
-
 Austria
-
 Azerbaijan
-
 Bahamas
-
 Bahrain
-
 Bangladesh
-
 Belarus
-
 Belgium
-
 Bolivia
-
 Botswana
-
 Brazil
-
 Brunei
-
 Bulgaria
-
 Cambodia
-
 Cameroon
-
 Canada
-
 Chile
Chile
-
 China
China
-
 Colombia
-
 Congo
Congo
-
 Costa Rica
-
 Cote d'Ivoire
-
 Croatia
-
 Cuba
Cuba
-
 Cyprus
-
 Czechia
-
 DR Congo
-
 Denmark
-
 Dominican Republic
-
 Ecuador
-
 Egypt
Egypt
-
 El Salvador
-
 Estonia
-
 Eswatini
-
 Ethiopia
-
 Finland
-
 France
-
 Georgia
-
 Germany
-
 Ghana
Ghana
-
 Greece
-
 Haiti
Haiti
-
 Hong Kong
-
 Hungary
-
 India
India
-
 Indonesia
-
 Iran, Islamic republic
-
 Iraq
Iraq
-
 Ireland
-
 Israel
-
 Italy
Italy
-
 Jamaica
-
 Japan
Japan
-
 Jordan
-
 Kazakhstan
-
 Kenya
Kenya
-
 Korea
Korea
-
 Kuwait
-
 Kyrgyzstan
-
 Laos
Laos
-
 Latvia
-
 Lebanon
-
 Lesotho
-
 Libya
Libya
-
 Lithuania
-
 Luxembourg
-
 Madagascar
-
 Malaysia
-
 Malta
Malta
-
 Mauritius
-
 Mexico
-
 Moldova
-
 Mongolia
-
 Montenegro
-
 Morocco
-
 Mozambique
-
 Myanmar
-
 Namibia
-
 Nepal
Nepal
-
 Netherlands
-
 New Zealand
-
 Nigeria
-
 North Macedonia
-
 Norway
-
 Oman
Oman
-
 Pakistan
-
 Palestine
-
 Panama
-
 Papua New Guinea
-
 Paraguay
-
 Peru
Peru
-
 Philippines
-
 Poland
-
 Portugal
-
 Puerto Rico
-
 Qatar
Qatar
-
 Reunion
-
 Romania
-
 Rwanda
-
 Saudi Arabia
-
 Serbia
-
 Singapore
-
 Slovakia
-
 Slovenia
-
 Somalia
-
 South Africa
-
 Spain
Spain
-
 Sri Lanka
-
 Sweden
-
 Switzerland
-
 Syria
Syria
-
 Taiwan
-
 Tajikistan
-
 Tanzania
-
 Thailand
-
 Trinidad and Tobago
-
 Tunisia
-
 Turkey
-
 UAE
UAE
-
 Uganda
-
 Ukraine
-
 United Kingdom
-
United States
-
 Uruguay
-
 Uzbekistan
-
 Venezuela
-
 Vietnam
-
 Yemen
Yemen
-
 Zambia
-
 Zimbabwe
- Forex
- Crypto












