

SoFi stock rises as upward price move follows anticipation ahead of earnings release

SoFi (SOFI) stock is trading at $14.83, up 3.78% for the day. The price sits above its key short-term moving average, although it remains below intermediate and long-term benchmarks.
 16.97
17.63
Highlights
- SoFi Technologies will release its Q3 2026 earnings before market open on Tuesday, October 27.
- Speculative interest in SoFi stock is rising as the earnings date increases focus on potential financial disclosures.
- SoFi stock trades above short-term averages but below medium- and long-term trends, with momentum indicators negative and a forecast range of $14.15 to $15.51.
Earnings anticipation drives speculative positioning ahead of financial update
SoFi Technologies is set to release its Q3 2026 earnings before the market opens on Tuesday, October 27, according to MarketBeat. The upcoming earnings date acts as a focal point for traders, driving event-oriented positioning and increasing speculative demand in advance of potential new financial disclosures. This scheduled announcement is heightening sensitivity to future developments, with investors closely watching for any catalysts from the results.
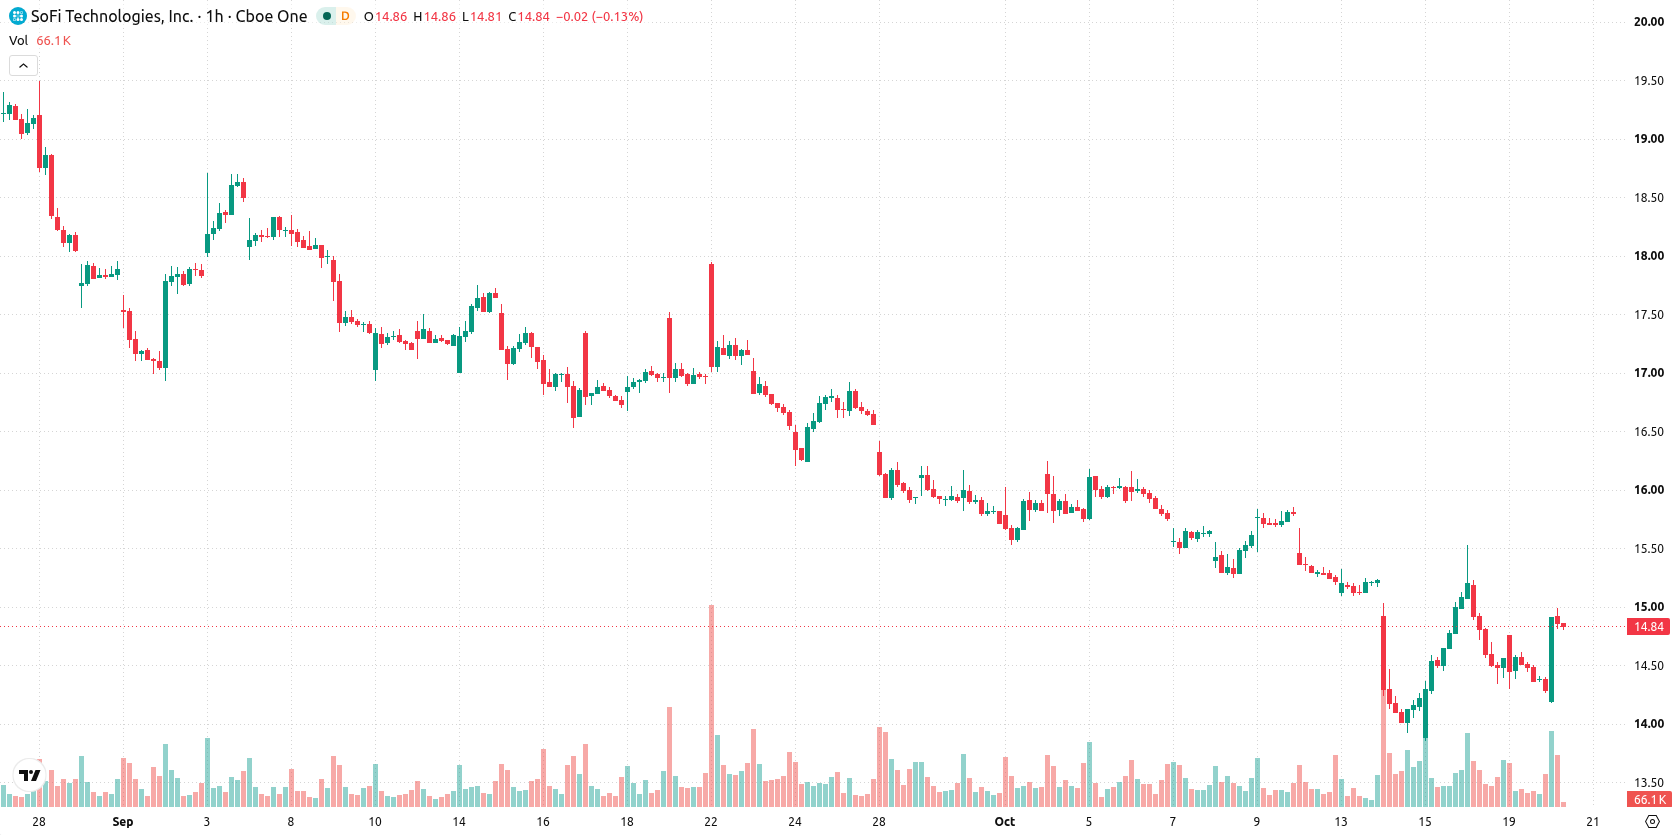
Downside pressure persists amid negative momentum and oversold signals
SOFI is currently trading above the MA-20 at $14.63, but still remains under the MA-50 at $14.91 and well below the MA-200 at $18.31. The Ichimoku Kijun line at $14.71 offers immediate support on the chart. Momentum remains negative, as indicated by both MACD and ADX, while the RSI registers at 36.73, reflecting a Sell signal. Both Stoch RSI and CCI show the stock in oversold territory, and sellers are confirmed to dominate intraday sentiment by the Bear/Bull Power and Awesome Oscillator readings.
Sideways movement expected as volatility shapes near-term outcomes
In the short term, the expected trading range for SOFI is $14.15 to $15.51, with a 48% probability of an upward move and a 52% probability of a downward move. The baseline scenario anticipates sideways trading within this range, reflecting current volatility dynamics. A break above resistance could propel the price towards the top of the forecast band, while a drop below immediate support may trigger a test of the lower boundary.
Earlier, analysts noted that SoFi continued to face downside risk and unresolved short-term trend uncertainty, even as it pursued strategic initiatives like its stablecoin launch. The current analysis adds that with technical signals still mixed ahead of the Q3 2026 earnings release, traders should closely monitor the $14.71–$14.91 zone for potential direction as volatility persists.










-
 Afghanistan
-
 Albania
-
 Algeria
-
 Angola
-
 Argentina
-
 Armenia
-
 Australia
-
 Austria
-
 Azerbaijan
-
 Bahamas
-
 Bahrain
-
 Bangladesh
-
 Belarus
-
 Belgium
-
 Bolivia
-
 Botswana
-
 Brazil
-
 Brunei
-
 Bulgaria
-
 Cambodia
-
 Cameroon
-
 Canada
-
 Chile
-
 China
-
 Colombia
-
 Congo
-
 Costa Rica
-
 Cote d'Ivoire
-
 Croatia
-
 Cuba
-
 Cyprus
-
 Czechia
-
 DR Congo
-
 Denmark
-
 Dominican Republic
-
 Ecuador
-
 Egypt
-
 El Salvador
-
 Estonia
-
 Eswatini
-
 Ethiopia
-
 Finland
-
 France
-
 Georgia
-
 Germany
-
 Ghana
-
 Greece
-
 Haiti
-
 Hong Kong
-
 Hungary
-
 India
-
 Indonesia
-
 Iran, Islamic republic
-
 Iraq
-
 Ireland
-
 Israel
-
 Italy
-
 Jamaica
-
 Japan
-
 Jordan
-
 Kazakhstan
-
 Kenya
-
 Korea
-
 Kuwait
-
 Kyrgyzstan
-
 Laos
-
 Latvia
-
 Lebanon
-
 Lesotho
-
 Libya
-
 Lithuania
-
 Luxembourg
-
 Madagascar
-
 Malaysia
-
 Malta
-
 Mauritius
-
 Mexico
-
 Moldova
-
 Mongolia
-
 Montenegro
-
 Morocco
-
 Mozambique
-
 Myanmar
-
 Namibia
-
 Nepal
-
 Netherlands
-
 New Zealand
-
 Nigeria
-
 North Macedonia
-
 Norway
-
 Oman
-
 Pakistan
-
 Palestine
-
 Panama
-
 Papua New Guinea
-
 Paraguay
-
 Peru
-
 Philippines
-
 Poland
-
 Portugal
-
 Puerto Rico
-
 Qatar
-
 Reunion
-
 Romania
-
 Rwanda
-
 Saudi Arabia
-
 Serbia
-
 Singapore
-
 Slovakia
-
 Slovenia
-
 Somalia
-
 South Africa
-
 Spain
-
 Sri Lanka
-
 Sweden
-
 Switzerland
-
 Syria
-
 Taiwan
-
 Tajikistan
-
 Tanzania
-
 Thailand
-
 Trinidad and Tobago
-
 Tunisia
-
 Turkey
-
 UAE
-
 Uganda
-
 Ukraine
-
 United Kingdom
-
United States
-
 Uruguay
-
 Uzbekistan
-
 Venezuela
-
 Vietnam
-
 Yemen
-
 Zambia
-
 Zimbabwe
- Forex
- Crypto












