

Newmont shares fall over 4% as analyst downgrades and selling pressure weigh ahead of earnings

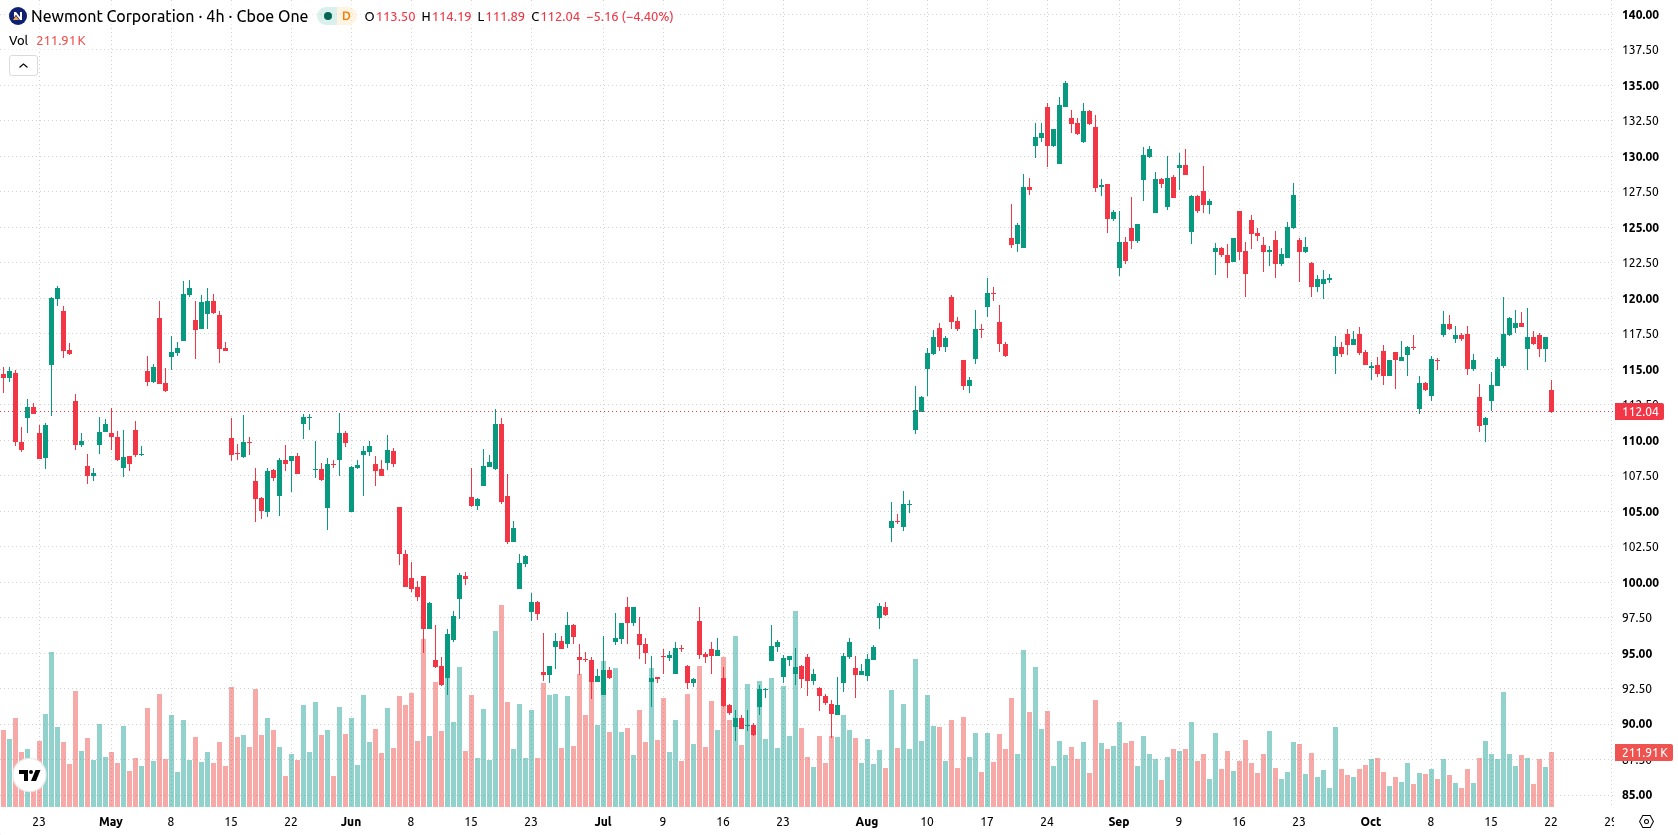
Newmont Corporation (NEM) fell 4.27% as renewed selling broke through short-term technical support, with sentiment pressured by recent analyst downgrades and anticipation of upcoming earnings. The downward move is reinforced by the stock trading below its 20-day, 50-day, and 200-day moving averages, highlighting sustained weakness within a mixed trend structure.
 114.23
116.37
Highlights
- Newmont projects 2026 gold production at 5.3 million ounces and reported $2.20 billion in free cash flow last quarter.
- The company and Barrick reached an agreement on joint venture properties at Nevada Gold Mines regarding property contributions and governance.
- Shares of Newmont fell 4.27% to $112.19, trading below key moving averages with technical signals showing bearish momentum and projected to hold between $109.69 to $114.69 in the next five days.
Institutional flows persist as earnings and joint ventures drive sentiment
Newmont Corporation is scheduled to release third-quarter 2026 earnings after the market closes on October 22, 2026. The company reported $2.90 billion in operating cash flow and $2.20 billion in free cash flow for the previous quarter, and reaffirmed its 2026 gold production guidance of 5.3 million ounces. An agreement was announced in August 2026 with Barrick regarding joint venture properties at Nevada Gold Mines, covering property contributions and governance. Institutional investors recently disclosed new acquisitions of shares, though price action has remained under broader selling pressure.
Downward bias persists as major averages and momentum weaken
Newmont is trading below its 20-day, 50-day, and 200-day moving averages at $116.54, $121.84, and $112.42, respectively, indicating pressure from sellers across short-, medium-, and long-term perspectives. The nearest resistance is at $112.42, with support at $109.69. While the MA-50 remains above the MA-200, suggesting a lingering medium-term bullish structure, daily momentum has turned weak. MACD signals notable selling pressure, and the ADX trend reading is neutral. The RSI stands at 47.94 and Stochastic RSI at 77.11, suggesting a neutral but slightly elevated condition, and Bull/Bear Power at 0.75 reflects buyers dominating intraday trades, despite an overbought signal. Overall, the daily trend is downward amid modest intraday volatility at 1.67%.
Earlier, analysts noted that Newmont offers significant leverage to any recovery in gold prices, with its fundamentals supported by strong free cash flow and robust balance sheet. With Newmont now approaching a critical support level at $109.69, traders should watch for a decisive break or sustained consolidation to signal the next directional move.






Latest Newmont Corporation News




-
 Afghanistan
-
 Albania
-
 Algeria
-
 Angola
-
 Argentina
-
 Armenia
-
 Australia
-
 Austria
-
 Azerbaijan
-
 Bahamas
-
 Bahrain
-
 Bangladesh
-
 Belarus
-
 Belgium
-
 Bolivia
-
 Botswana
-
 Brazil
-
 Brunei
-
 Bulgaria
-
 Cambodia
-
 Cameroon
-
 Canada
-
 Chile
-
 China
-
 Colombia
-
 Congo
-
 Costa Rica
-
 Cote d'Ivoire
-
 Croatia
-
 Cuba
-
 Cyprus
-
 Czechia
-
 DR Congo
-
 Denmark
-
 Dominican Republic
-
 Ecuador
-
 Egypt
-
 El Salvador
-
 Estonia
-
 Eswatini
-
 Ethiopia
-
 Finland
-
 France
-
 Georgia
-
 Germany
-
 Ghana
-
 Greece
-
 Haiti
-
 Hong Kong
-
 Hungary
-
 India
-
 Indonesia
-
 Iran, Islamic republic
-
 Iraq
-
 Ireland
-
 Israel
-
 Italy
-
 Jamaica
-
 Japan
-
 Jordan
-
 Kazakhstan
-
 Kenya
-
 Korea
-
 Kuwait
-
 Kyrgyzstan
-
 Laos
-
 Latvia
-
 Lebanon
-
 Lesotho
-
 Libya
-
 Lithuania
-
 Luxembourg
-
 Madagascar
-
 Malaysia
-
 Malta
-
 Mauritius
-
 Mexico
-
 Moldova
-
 Mongolia
-
 Montenegro
-
 Morocco
-
 Mozambique
-
 Myanmar
-
 Namibia
-
 Nepal
-
 Netherlands
-
 New Zealand
-
 Nigeria
-
 North Macedonia
-
 Norway
-
 Oman
-
 Pakistan
-
 Palestine
-
 Panama
-
 Papua New Guinea
-
 Paraguay
-
 Peru
-
 Philippines
-
 Poland
-
 Portugal
-
 Puerto Rico
-
 Qatar
-
 Reunion
-
 Romania
-
 Rwanda
-
 Saudi Arabia
-
 Serbia
-
 Singapore
-
 Slovakia
-
 Slovenia
-
 Somalia
-
 South Africa
-
 Spain
-
 Sri Lanka
-
 Sweden
-
 Switzerland
-
 Syria
-
 Taiwan
-
 Tajikistan
-
 Tanzania
-
 Thailand
-
 Trinidad and Tobago
-
 Tunisia
-
 Turkey
-
 UAE
-
 Uganda
-
 Ukraine
-
 United Kingdom
-
United States
-
 Uruguay
-
 Uzbekistan
-
 Venezuela
-
 Vietnam
-
 Yemen
-
 Zambia
-
 Zimbabwe
- Forex
- Crypto












