

BT-A trades flat as buyer support holds above GBX209.05

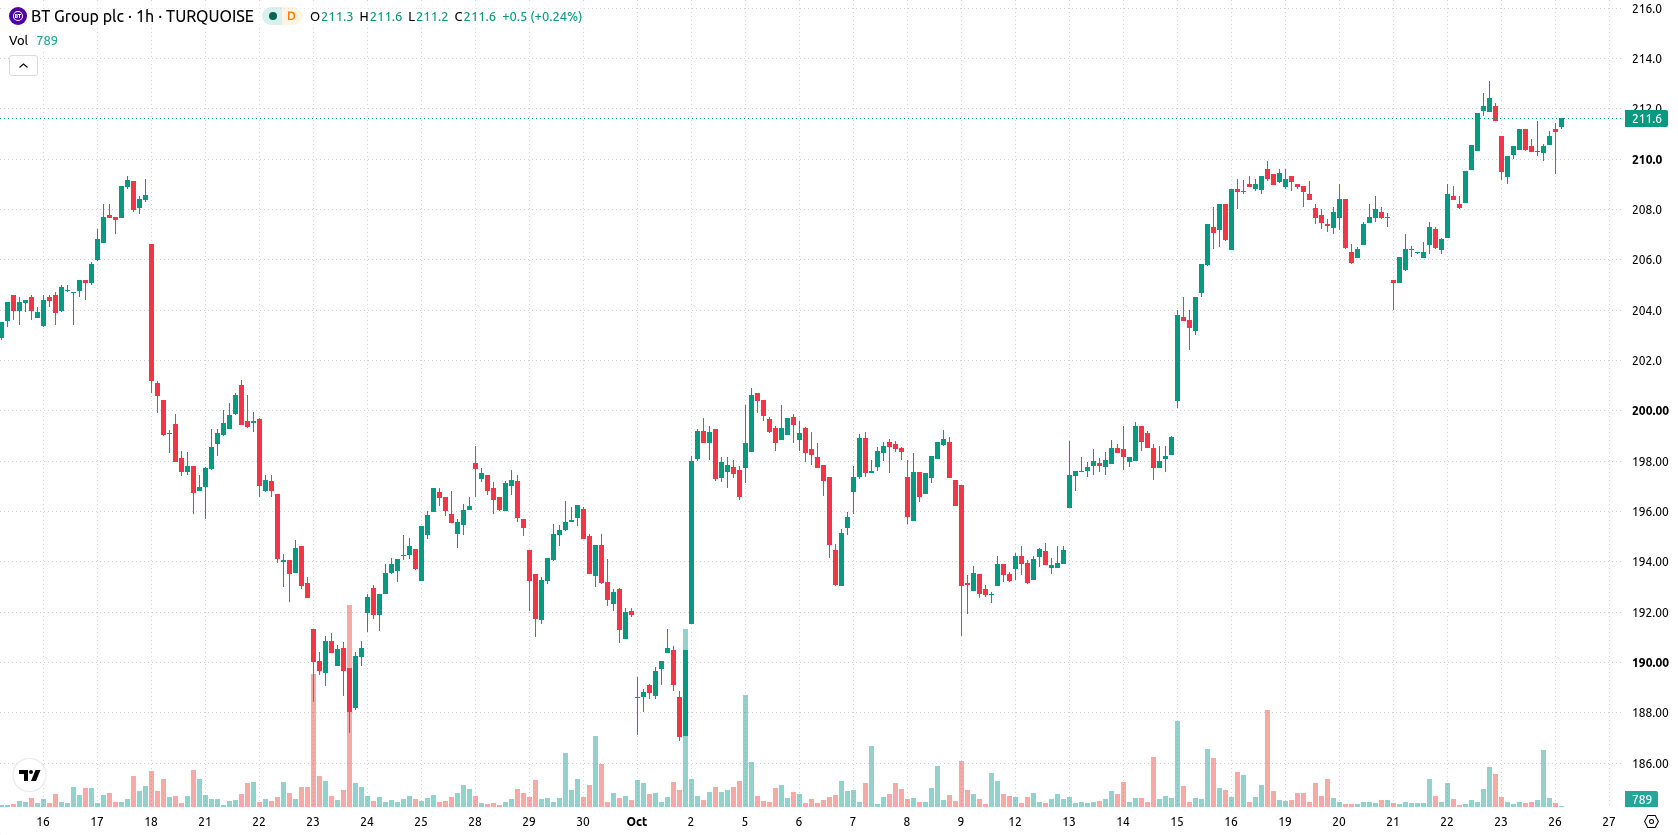
BT Group (BT-A) stock is trading at GBX210.8, marking a modest decline on the session. The price remains above its key moving averages, reflecting supportive momentum across multiple timeframes.
 215.20
Highlights
- BT-A/GBX stock holds above key moving averages across all timeframes, indicating sustained bullish momentum.
- Despite intraday buyer dominance, overbought signals from RSI and Stoch RSI suggest increased risk of a short-term pullback.
- Expected price range for the next four days is GBX206.61 to GBX214.99, with a high probability of an upward move.
Mixed momentum signals as buyers dominate but overbought risk rises
On the technical front, BT-A is holding above the MA-20 and MA-50 on the hourly chart and above the MA-200 on the daily chart. The Ichimoku Kijun at GBX209.05 offers immediate support. Within momentum signals, MACD flashes a Strong Buy while the ADX remains Neutral. Both RSI and Stochastic RSI are in overbought territory, and CCI displays a Buy reading. Bull/Bear Power shows buyers dominating intraday action but is also classified as overbought. The Awesome Oscillator is Neutral and does not provide directional confirmation. The price settled at GBX210.8, closing with a moderate downward gap and moderate volatility, leaving the session in a mid-range position amid active trading.
Bullish breakout favored as indicators reduce downside probability
In the near term, the typical volatility band is set between GBX206.61 and GBX214.99 for the next four trading days. The probability of an upward move is assessed as very high given current indicator alignments, while the chance of a significant downside break remains low. The base scenario sees BT-A fluctuating within this corridor, with a bullish breakout targeting the upper boundary and a downward break toward the lower support.
Previously it was reported that BT Group shares faced near-term consolidation risks amid ongoing bullish momentum and technical overbought conditions. The current analysis reinforces these themes, with upbeat momentum still prevailing; traders should now monitor for a potential breakout from the GBX206.61–GBX214.99 range as the next inflection point.










-
 Afghanistan
-
 Albania
-
 Algeria
-
 Angola
-
 Argentina
-
 Armenia
-
 Australia
-
 Austria
-
 Azerbaijan
-
 Bahamas
-
 Bahrain
-
 Bangladesh
-
 Belarus
-
 Belgium
-
 Bolivia
-
 Botswana
-
 Brazil
-
 Brunei
-
 Bulgaria
-
 Cambodia
-
 Cameroon
-
 Canada
-
 Chile
-
 China
-
 Colombia
-
 Congo
-
 Costa Rica
-
 Cote d'Ivoire
-
 Croatia
-
 Cuba
-
 Cyprus
-
 Czechia
-
 DR Congo
-
 Denmark
-
 Dominican Republic
-
 Ecuador
-
 Egypt
-
 El Salvador
-
 Estonia
-
 Eswatini
-
 Ethiopia
-
 Finland
-
 France
-
 Georgia
-
 Germany
-
 Ghana
-
 Greece
-
 Haiti
-
 Hong Kong
-
 Hungary
-
 India
-
 Indonesia
-
 Iran, Islamic republic
-
 Iraq
-
 Ireland
-
 Israel
-
 Italy
-
 Jamaica
-
 Japan
-
 Jordan
-
 Kazakhstan
-
 Kenya
-
 Korea
-
 Kuwait
-
 Kyrgyzstan
-
 Laos
-
 Latvia
-
 Lebanon
-
 Lesotho
-
 Libya
-
 Lithuania
-
 Luxembourg
-
 Madagascar
-
 Malaysia
-
 Malta
-
 Mauritius
-
 Mexico
-
 Moldova
-
 Mongolia
-
 Montenegro
-
 Morocco
-
 Mozambique
-
 Myanmar
-
 Namibia
-
 Nepal
-
 Netherlands
-
 New Zealand
-
 Nigeria
-
 North Macedonia
-
 Norway
-
 Oman
-
 Pakistan
-
 Palestine
-
 Panama
-
 Papua New Guinea
-
 Paraguay
-
 Peru
-
 Philippines
-
 Poland
-
 Portugal
-
 Puerto Rico
-
 Qatar
-
 Reunion
-
 Romania
-
 Rwanda
-
 Saudi Arabia
-
 Serbia
-
 Singapore
-
 Slovakia
-
 Slovenia
-
 Somalia
-
 South Africa
-
 Spain
-
 Sri Lanka
-
 Sweden
-
 Switzerland
-
 Syria
-
 Taiwan
-
 Tajikistan
-
 Tanzania
-
 Thailand
-
 Trinidad and Tobago
-
 Tunisia
-
 Turkey
-
 UAE
-
 Uganda
-
 Ukraine
-
 United Kingdom
-
United States
-
 Uruguay
-
 Uzbekistan
-
 Venezuela
-
 Vietnam
-
 Yemen
-
 Zambia
-
 Zimbabwe
- Forex
- Crypto












