

BT Group shares technical analysis: Consolidation near GBX210.1 support highlights mixed momentum

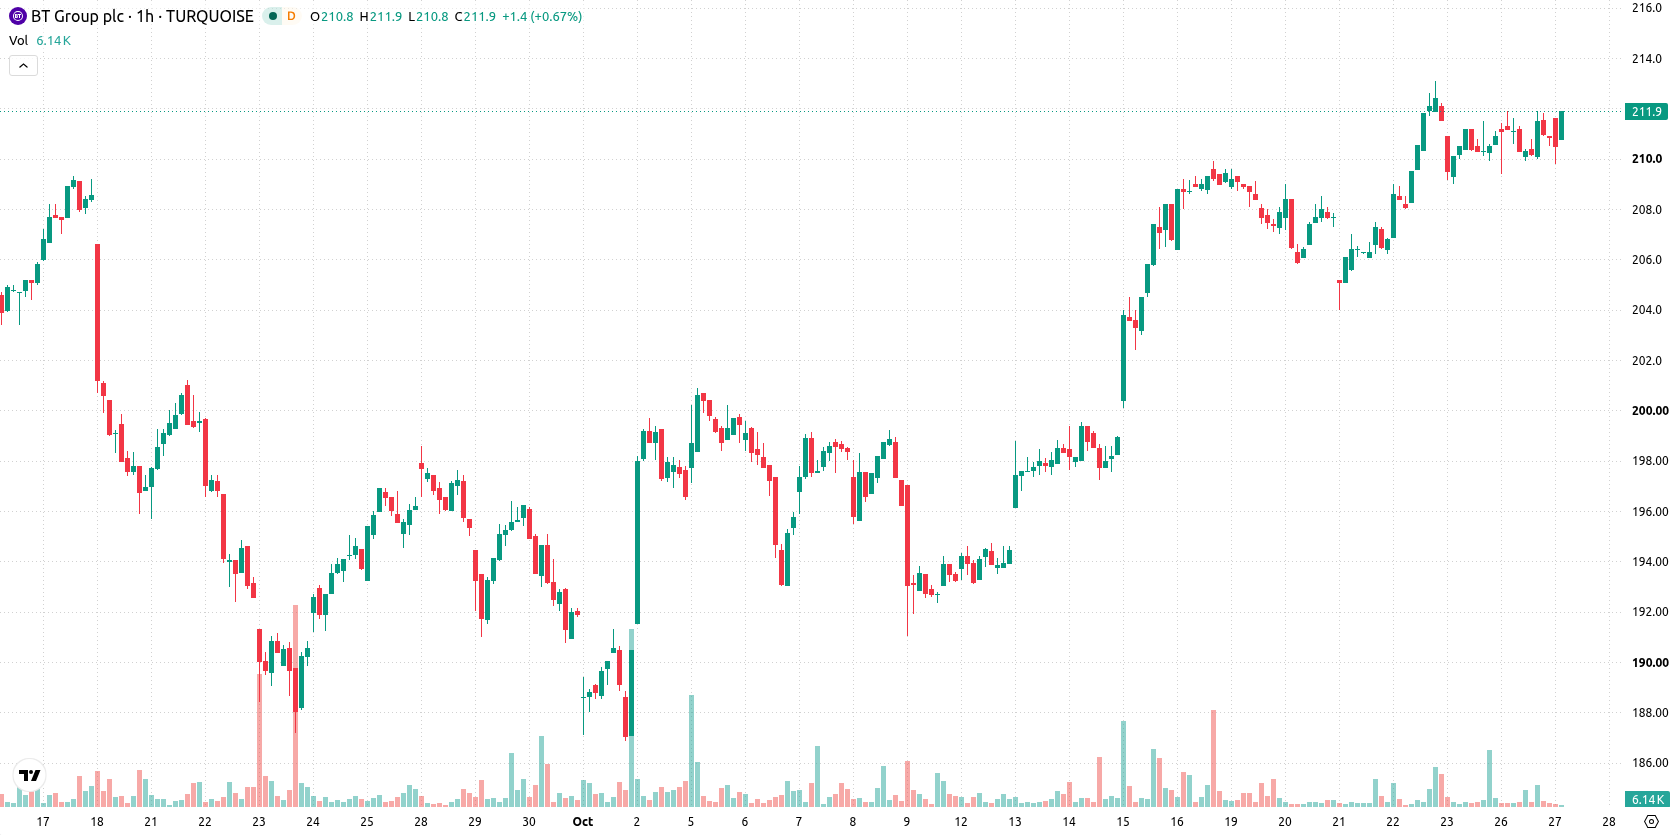
BT Group (BT-A) stock is trading at GBX210.8 after a modest move lower on the day. The price remains above its key moving averages, indicating that it continues to hold recent support despite a narrow daily trading range.
 214.40
Highlights
- BT Group and its brands recorded above-industry-average complaint rates for fixed line and broadband between April and June 2026, raising reputational risk.
- BT International expanded its Global Fabric network with four security provider options to support enterprise needs as AI-based traffic increases.
- Shares of BT Group show short- and medium-term bullish momentum with an expected trading range of GBX206.61 to GBX214.99 and a high probability of upside.
Elevated complaint rates and network expansion reshape BT's risk profile
BT Group and its brands, including EE and Plusnet, were reported by Telecoms to have ranked above the industry average for complaints in the fixed line and broadband segments for the April to June 2026 period. Elevated complaint levels may affect customer perceptions and could result in greater operational scrutiny, potentially introducing reputational risk. Separately, Securitybrief Com reported that BT International expanded its Global Fabric network platform by offering multinational firms a choice of four security providers, a step that may enable the company to better address enterprise client requirements as AI traffic places higher demands on network capabilities.
Divergence in buy signals and oscillator strength above key averages
On the technical front, BT-A trades above the MA-20 at GBX210.76 and MA-50 at GBX208.92 on the intraday chart, with the daily price also holding over the MA-200 at GBX204.02. The Ichimoku Kijun at GBX210.1 is the closest support reference. RSI registers at 54.84 in buy territory, while Stoch RSI and CCI are neutral. MACD gives a strong buy reading; ADX is neutral. Intraday Bull/Bear Power stands in strong buy mode, but the Awesome Oscillator remains neutral, illustrating a divide between robust momentum and tempered oscillator signals.
Upside bias prevails as volatility band outlines bullish scenario
For the next 2–3 days, BT-A is expected to trade within a volatility band from GBX206.61 to GBX214.99. The probability of an upside move is very high, making a continuation above current levels the most likely scenario. A break above GBX214.99 would trigger further bullish price action, while a drop below GBX206.61 would open a short-term bearish scenario.
Earlier, analysts noted that BT Group shares were experiencing bullish momentum while facing near-term consolidation risks. The current analysis adds that, alongside this supportive technical backdrop, traders should closely monitor how elevated complaint rates and recent strategic network expansions may influence price action and emergence of new support or resistance levels in the days ahead.










-
 Afghanistan
-
 Albania
-
 Algeria
-
 Angola
-
 Argentina
-
 Armenia
-
 Australia
-
 Austria
-
 Azerbaijan
-
 Bahamas
-
 Bahrain
-
 Bangladesh
-
 Belarus
-
 Belgium
-
 Bolivia
-
 Botswana
-
 Brazil
-
 Brunei
-
 Bulgaria
-
 Cambodia
-
 Cameroon
-
 Canada
-
 Chile
-
 China
-
 Colombia
-
 Congo
-
 Costa Rica
-
 Cote d'Ivoire
-
 Croatia
-
 Cuba
-
 Cyprus
-
 Czechia
-
 DR Congo
-
 Denmark
-
 Dominican Republic
-
 Ecuador
-
 Egypt
-
 El Salvador
-
 Estonia
-
 Eswatini
-
 Ethiopia
-
 Finland
-
 France
-
 Georgia
-
 Germany
-
 Ghana
-
 Greece
-
 Haiti
-
 Hong Kong
-
 Hungary
-
 India
-
 Indonesia
-
 Iran, Islamic republic
-
 Iraq
-
 Ireland
-
 Israel
-
 Italy
-
 Jamaica
-
 Japan
-
 Jordan
-
 Kazakhstan
-
 Kenya
-
 Korea
-
 Kuwait
-
 Kyrgyzstan
-
 Laos
-
 Latvia
-
 Lebanon
-
 Lesotho
-
 Libya
-
 Lithuania
-
 Luxembourg
-
 Madagascar
-
 Malaysia
-
 Malta
-
 Mauritius
-
 Mexico
-
 Moldova
-
 Mongolia
-
 Montenegro
-
 Morocco
-
 Mozambique
-
 Myanmar
-
 Namibia
-
 Nepal
-
 Netherlands
-
 New Zealand
-
 Nigeria
-
 North Macedonia
-
 Norway
-
 Oman
-
 Pakistan
-
 Palestine
-
 Panama
-
 Papua New Guinea
-
 Paraguay
-
 Peru
-
 Philippines
-
 Poland
-
 Portugal
-
 Puerto Rico
-
 Qatar
-
 Reunion
-
 Romania
-
 Rwanda
-
 Saudi Arabia
-
 Serbia
-
 Singapore
-
 Slovakia
-
 Slovenia
-
 Somalia
-
 South Africa
-
 Spain
-
 Sri Lanka
-
 Sweden
-
 Switzerland
-
 Syria
-
 Taiwan
-
 Tajikistan
-
 Tanzania
-
 Thailand
-
 Trinidad and Tobago
-
 Tunisia
-
 Turkey
-
 UAE
-
 Uganda
-
 Ukraine
-
 United Kingdom
-
United States
-
 Uruguay
-
 Uzbekistan
-
 Venezuela
-
 Vietnam
-
 Yemen
-
 Zambia
-
 Zimbabwe
- Forex
- Crypto












