

Barrick Gold shares technical analysis: Range-bound with support at C$53.74 under pressure

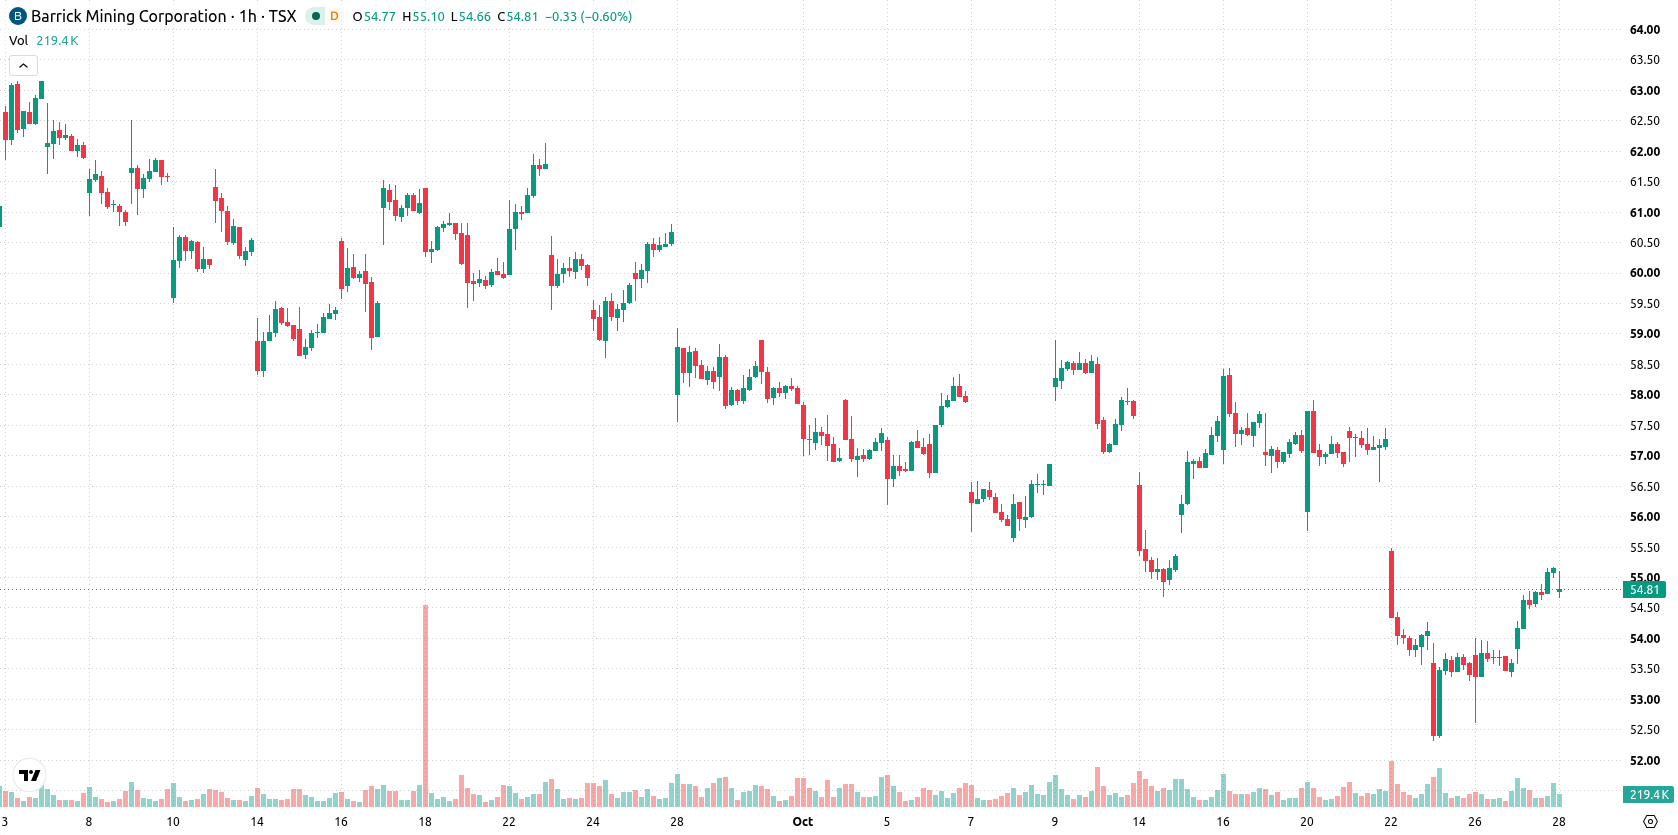
Barrick Gold (ABX) stock is trading at C$54.71 after a modest decline today. The price sits above its key short-term moving averages but remains below medium- and long-term benchmarks, reflecting mixed short-term momentum and lingering seller influence.
 52.19
55.57
Highlights
- ABX/CAD stock trades above its short-term average but remains below key medium- and long-term resistance levels.
- Momentum indicators are mixed, showing intraday buyer strength but weak trend conviction with several overbought signals.
- Expected trading range over the next several days is C$53.3 to C$56.12, with a 62% probability of a downward move.
Conflicting technical signals as ABX faces overbought conditions
On the technical front, ABX/CAD trades above the MA-20 (C$54.05) but is still below the MA-50 (C$55.3) and the long-term MA-200 (C$58.79). The immediate support is marked by the Ichimoku Kijun level at C$53.74. Momentum signals are divided: MACD is neutral, ADX indicates a Sell bias suggesting weak trend conviction, and RSI at 55.1 highlights slight buying momentum. However, both Stoch RSI and CCI register overbought conditions, and Bull/Bear Power continues to show intraday buyer dominance. The Awesome Oscillator confirms the recent upward move, but conflicting signals from oscillators and broader momentum indicators underscore a lack of consensus in the market.
Sideways bias prevails as downside risk remains elevated
In the short term, ABX/CAD is expected to trade between C$53.3 and C$56.12, forming a sideways channel consistent with recent volatility. Probability of a downward move is higher at 62%, while a break above the upper range would require sustained buyer commitment. If support at C$53.74 fails, price may retreat further within the typical volatility band for the upcoming sessions.
Earlier, analysts noted that Barrick Gold’s technical outlook was broadly bearish despite positive developments, with market attention focused on cash flow reliability and sustained buyer strength for a potential reversal. The current analysis validates ongoing mixed momentum and highlights that continued monitoring of the C$53.74 support level is crucial, as a failure to hold could trigger further downside within the established volatility band.






Latest Barrick Gold News




-
 Afghanistan
-
 Albania
-
 Algeria
-
 Angola
-
 Argentina
-
 Armenia
-
 Australia
-
 Austria
-
 Azerbaijan
-
 Bahamas
-
 Bahrain
-
 Bangladesh
-
 Belarus
-
 Belgium
-
 Bolivia
-
 Botswana
-
 Brazil
-
 Brunei
-
 Bulgaria
-
 Cambodia
-
 Cameroon
-
 Canada
-
 Chile
-
 China
-
 Colombia
-
 Congo
-
 Costa Rica
-
 Cote d'Ivoire
-
 Croatia
-
 Cuba
-
 Cyprus
-
 Czechia
-
 DR Congo
-
 Denmark
-
 Dominican Republic
-
 Ecuador
-
 Egypt
-
 El Salvador
-
 Estonia
-
 Eswatini
-
 Ethiopia
-
 Finland
-
 France
-
 Georgia
-
 Germany
-
 Ghana
-
 Greece
-
 Haiti
-
 Hong Kong
-
 Hungary
-
 India
-
 Indonesia
-
 Iran, Islamic republic
-
 Iraq
-
 Ireland
-
 Israel
-
 Italy
-
 Jamaica
-
 Japan
-
 Jordan
-
 Kazakhstan
-
 Kenya
-
 Korea
-
 Kuwait
-
 Kyrgyzstan
-
 Laos
-
 Latvia
-
 Lebanon
-
 Lesotho
-
 Libya
-
 Lithuania
-
 Luxembourg
-
 Madagascar
-
 Malaysia
-
 Malta
-
 Mauritius
-
 Mexico
-
 Moldova
-
 Mongolia
-
 Montenegro
-
 Morocco
-
 Mozambique
-
 Myanmar
-
 Namibia
-
 Nepal
-
 Netherlands
-
 New Zealand
-
 Nigeria
-
 North Macedonia
-
 Norway
-
 Oman
-
 Pakistan
-
 Palestine
-
 Panama
-
 Papua New Guinea
-
 Paraguay
-
 Peru
-
 Philippines
-
 Poland
-
 Portugal
-
 Puerto Rico
-
 Qatar
-
 Reunion
-
 Romania
-
 Rwanda
-
 Saudi Arabia
-
 Serbia
-
 Singapore
-
 Slovakia
-
 Slovenia
-
 Somalia
-
 South Africa
-
 Spain
-
 Sri Lanka
-
 Sweden
-
 Switzerland
-
 Syria
-
 Taiwan
-
 Tajikistan
-
 Tanzania
-
 Thailand
-
 Trinidad and Tobago
-
 Tunisia
-
 Turkey
-
 UAE
-
 Uganda
-
 Ukraine
-
 United Kingdom
-
United States
-
 Uruguay
-
 Uzbekistan
-
 Venezuela
-
 Vietnam
-
 Yemen
-
 Zambia
-
 Zimbabwe
- Forex
- Crypto












