

Vodafone stock forecast: Sideways trading expected between support and resistance

Vodafone (VOD) stock is trading at GBX117.95, posting a modest decline on the day. The price currently sits just above short-term averages, while remaining well supported above long-term trends.
 118.95
119.60
Highlights
- CCI approved Xavier Niel's £4.4 billion purchase of a 16.2% stake in Vodafone, making him the largest shareholder.
- The addition of substantial new capital and a major investor could affect Vodafone's long-term strategy and market profile.
- Shares of Vodafone trade in a tight GBX116.68 to GBX119.5 range as overbought indicators and weak trend signals suggest further sideways movement.
Niel stake wins regulatory approval as strategic positioning shifts
The Competition Commission of India (CCI) has approved the acquisition of a 16.2% stake in Vodafone Group Plc by French billionaire Xavier Niel through his investment vehicle Vega SAS, valued at approximately £4.4 billion, according to Ceoworld. This regulatory clearance introduces a significant new shareholder to Vodafone, consolidating Niel's position as the largest stakeholder and adding substantial capital to the company's register. The shift in ownership structure and participation from a major investor has the potential to influence long-term strategic direction and market perception, though price action has remained under broader selling pressure.
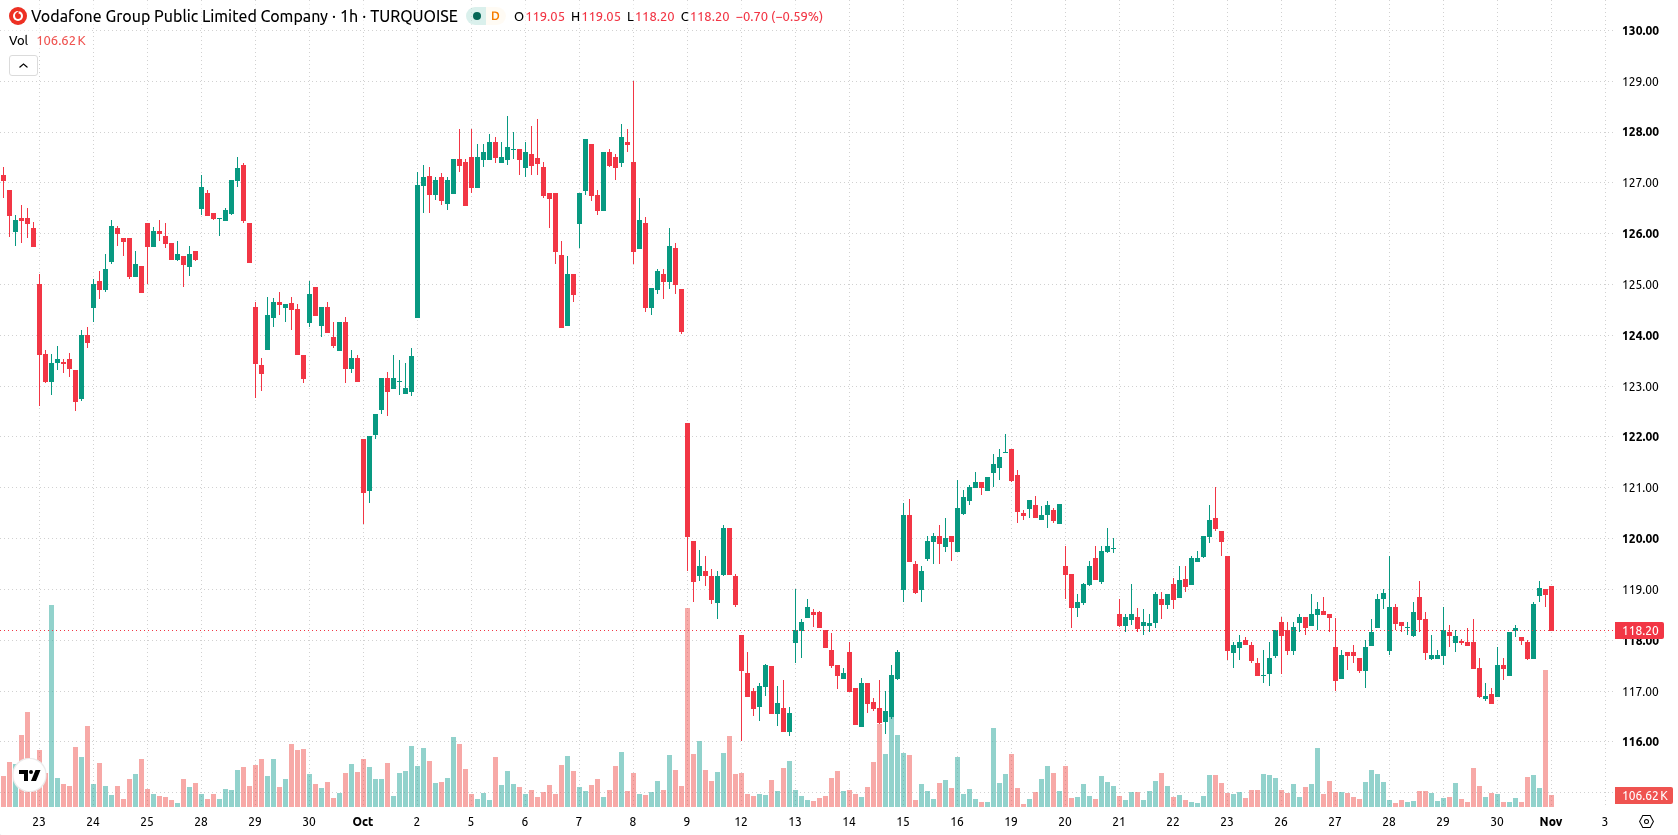
Mixed momentum flags overbought risks amid neutral trend signals
On the hourly chart, VOD is trading above the MA-20 at GBX117.85 but just below the MA-50 at GBX118, while staying well above the daily MA-200 at GBX114.88. The Ichimoku Kijun acts as immediate support near GBX117.93. Hourly RSI stands at 62.94, suggesting ongoing buying interest. MACD and ADX are neutral, while overbought signals come from both the Stochastic RSI and CCI. Bull/Bear Power supports the presence of buyers in intraday trading, but the Awesome Oscillator remains flat. The indicators present a mixed picture as oscillators signal caution due to overbought conditions, contrasted with neutral trend measures and subdued volatility.
Sideways bias persists as breakout risk slightly favors upside
In the short term, VOD is expected to range between GBX116.68 and GBX119.5, reflecting a typical volatility band relative to current levels. The baseline scenario points to sideways trading within this corridor. If the price exceeds GBX119.5, a further upward move may be confirmed, while a fall below GBX116.68 could accelerate selling pressure. Probabilities favor an upward breakout at 67%, with a 33% chance of a downward move.
Earlier, analysts noted that Vodafone faced ongoing seller pressure and near-term technical weakness despite long-term support. The latest developments introduce a major new shareholder and fresh capital, suggesting investors should monitor for a breakout beyond the current GBX116.68–GBX119.5 range as shifts in ownership may alter medium-term risk and reward dynamics.






Latest Vodafone News



-
 Afghanistan
-
 Albania
-
 Algeria
-
 Angola
-
 Argentina
-
 Armenia
-
 Australia
-
 Austria
-
 Azerbaijan
-
 Bahamas
-
 Bahrain
-
 Bangladesh
-
 Belarus
-
 Belgium
-
 Bolivia
-
 Botswana
-
 Brazil
-
 Brunei
-
 Bulgaria
-
 Cambodia
-
 Cameroon
-
 Canada
-
 Chile
-
 China
-
 Colombia
-
 Congo
-
 Costa Rica
-
 Cote d'Ivoire
-
 Croatia
-
 Cuba
-
 Cyprus
-
 Czechia
-
 DR Congo
-
 Denmark
-
 Dominican Republic
-
 Ecuador
-
 Egypt
-
 El Salvador
-
 Estonia
-
 Eswatini
-
 Ethiopia
-
 Finland
-
 France
-
 Georgia
-
 Germany
-
 Ghana
-
 Greece
-
 Haiti
-
 Hong Kong
-
 Hungary
-
 India
-
 Indonesia
-
 Iran, Islamic republic
-
 Iraq
-
 Ireland
-
 Israel
-
 Italy
-
 Jamaica
-
 Japan
-
 Jordan
-
 Kazakhstan
-
 Kenya
-
 Korea
-
 Kuwait
-
 Kyrgyzstan
-
 Laos
-
 Latvia
-
 Lebanon
-
 Lesotho
-
 Libya
-
 Lithuania
-
 Luxembourg
-
 Madagascar
-
 Malaysia
-
 Malta
-
 Mauritius
-
 Mexico
-
 Moldova
-
 Mongolia
-
 Montenegro
-
 Morocco
-
 Mozambique
-
 Myanmar
-
 Namibia
-
 Nepal
-
 Netherlands
-
 New Zealand
-
 Nigeria
-
 North Macedonia
-
 Norway
-
 Oman
-
 Pakistan
-
 Palestine
-
 Panama
-
 Papua New Guinea
-
 Paraguay
-
 Peru
-
 Philippines
-
 Poland
-
 Portugal
-
 Puerto Rico
-
 Qatar
-
 Reunion
-
 Romania
-
 Rwanda
-
 Saudi Arabia
-
 Serbia
-
 Singapore
-
 Slovakia
-
 Slovenia
-
 Somalia
-
 South Africa
-
 Spain
-
 Sri Lanka
-
 Sweden
-
 Switzerland
-
 Syria
-
 Taiwan
-
 Tajikistan
-
 Tanzania
-
 Thailand
-
 Trinidad and Tobago
-
 Tunisia
-
 Turkey
-
 UAE
-
 Uganda
-
 Ukraine
-
 United Kingdom
-
United States
-
 Uruguay
-
 Uzbekistan
-
 Venezuela
-
 Vietnam
-
 Yemen
-
 Zambia
-
 Zimbabwe
- Forex
- Crypto












