

BKKT rises as rebound attempt meets immediate resistance at $4.89

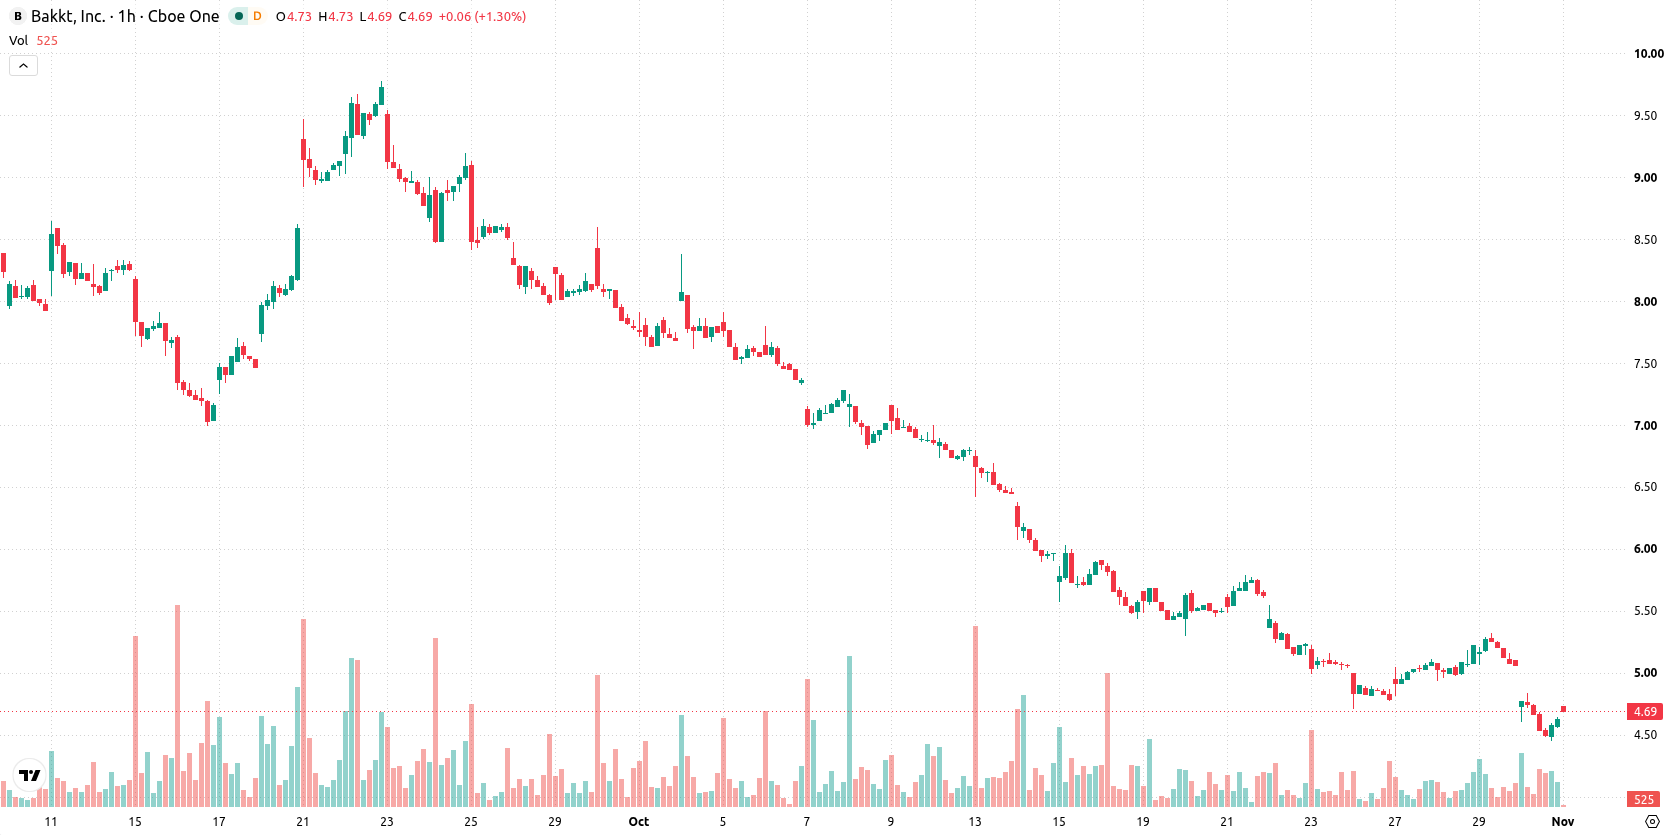
Bakkt (BKKT) stock is trading at $4.77, up 3.14% on the day. The price is positioned below its key moving averages, indicating continued pressure in the current session.
 4.67
5.33
Highlights
- BKKT/USD trades below key moving averages across all timeframes, with seller pressure maintaining the bearish trend.
- Negative momentum persists as multiple technical indicators show sell signals and oversold conditions, despite a recent price bounce.
- The expected price range for the next 2 to 3 days is $4.32 to $5.16, with a 77% probability of further downside.
Bearish momentum persists as key resistance caps recovery
On the technical front, BKKT is trading below the hourly MA-20 ($4.95) and MA-50 ($5.02), as well as the daily MA-200 ($8.86). The Ichimoku Kijun on the daily timeframe is at $4.89, providing immediate resistance. Momentum indicators remain negative: MACD and ADX continue to signal Sell conditions, while RSI stands at 34.89 and CCI is in Oversold territory, both pointing to downward exhaustion. Stochastic RSI is Neutral, Bull/Bear Power favors sellers, and the Awesome Oscillator aligns with the ongoing downtrend. Price action has shown a bounce intraday, with notable divergence between short-term recovery and persisting overall bearish momentum.
Sideways consolidation likely as bearish risk outweighs rebound
In the short term, BKKT is expected to trade within a range of $4.32 to $5.16 over the next 2–3 sessions, reflecting a volatility band relative to current levels. The likelihood of an upward move is limited at 23%, while a downward move has a higher probability of 77%, suggesting that a sustained rebound is less likely. The baseline scenario calls for sideways consolidation within this band; a bullish scenario would require a clear break above $4.89 to target the upper end, while a move below $4.32 could trigger further downside in line with momentum and indicator signals.
Earlier, analysts noted that Bakkt’s technical outlook was dominated by downside risks and persistent selling pressure. The current analysis reinforces this view, emphasizing that traders should closely monitor the $4.89 resistance and $4.32 support levels for signals of a potential shift in momentum.






Latest Bakkt News




-
 Afghanistan
-
 Albania
-
 Algeria
-
 Angola
-
 Argentina
-
 Armenia
-
 Australia
-
 Austria
-
 Azerbaijan
-
 Bahamas
-
 Bahrain
-
 Bangladesh
-
 Belarus
-
 Belgium
-
 Bolivia
-
 Botswana
-
 Brazil
-
 Brunei
-
 Bulgaria
-
 Cambodia
-
 Cameroon
-
 Canada
-
 Chile
-
 China
-
 Colombia
-
 Congo
-
 Costa Rica
-
 Cote d'Ivoire
-
 Croatia
-
 Cuba
-
 Cyprus
-
 Czechia
-
 DR Congo
-
 Denmark
-
 Dominican Republic
-
 Ecuador
-
 Egypt
-
 El Salvador
-
 Estonia
-
 Eswatini
-
 Ethiopia
-
 Finland
-
 France
-
 Georgia
-
 Germany
-
 Ghana
-
 Greece
-
 Haiti
-
 Hong Kong
-
 Hungary
-
 India
-
 Indonesia
-
 Iran, Islamic republic
-
 Iraq
-
 Ireland
-
 Israel
-
 Italy
-
 Jamaica
-
 Japan
-
 Jordan
-
 Kazakhstan
-
 Kenya
-
 Korea
-
 Kuwait
-
 Kyrgyzstan
-
 Laos
-
 Latvia
-
 Lebanon
-
 Lesotho
-
 Libya
-
 Lithuania
-
 Luxembourg
-
 Madagascar
-
 Malaysia
-
 Malta
-
 Mauritius
-
 Mexico
-
 Moldova
-
 Mongolia
-
 Montenegro
-
 Morocco
-
 Mozambique
-
 Myanmar
-
 Namibia
-
 Nepal
-
 Netherlands
-
 New Zealand
-
 Nigeria
-
 North Macedonia
-
 Norway
-
 Oman
-
 Pakistan
-
 Palestine
-
 Panama
-
 Papua New Guinea
-
 Paraguay
-
 Peru
-
 Philippines
-
 Poland
-
 Portugal
-
 Puerto Rico
-
 Qatar
-
 Reunion
-
 Romania
-
 Rwanda
-
 Saudi Arabia
-
 Serbia
-
 Singapore
-
 Slovakia
-
 Slovenia
-
 Somalia
-
 South Africa
-
 Spain
-
 Sri Lanka
-
 Sweden
-
 Switzerland
-
 Syria
-
 Taiwan
-
 Tajikistan
-
 Tanzania
-
 Thailand
-
 Trinidad and Tobago
-
 Tunisia
-
 Turkey
-
 UAE
-
 Uganda
-
 Ukraine
-
 United Kingdom
-
United States
-
 Uruguay
-
 Uzbekistan
-
 Venezuela
-
 Vietnam
-
 Yemen
-
 Zambia
-
 Zimbabwe
- Forex
- Crypto












